
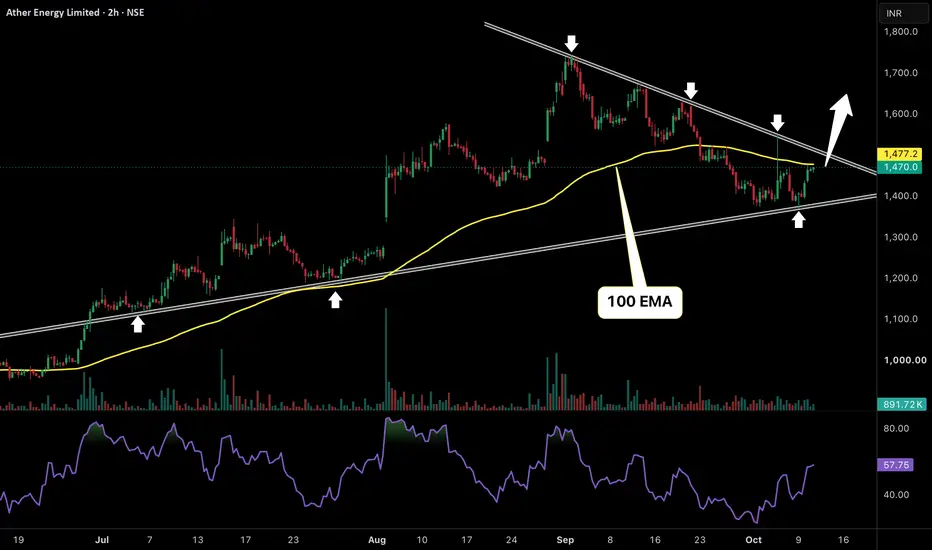
Ather Energy is developing a very interesting symmetrical triangle pattern on the 2-hour chart and the stock is now approaching a crucial breakout zone. After making a high near 1750 in September the stock started forming lower highs as sellers repeatedly rejected every recovery near the descending resistance trendline. But what makes this structure interesting is that buyers have continued defending the rising support trendline which has been respected multiple times since July. This means sellers are pushing prices lower from the top but buyers are gradually absorbing the selling pressure at higher support levels. Both trendlines are now converging near 1470–1500 and price is getting compressed inside a narrow range. The recent bounce from 1380–1400 shows buyers are still active while RSI has recovered towards 58. The stock is also attempting to reclaim its 100 EMA near 1477 which makes this zone even more important.
Now the real momentum can begin once Ather breaks and sustains above 1500–1520 with strong volume. Such a breakout would invalidate the series of lower highs and signal that buyers are finally overcoming the selling pressure that has controlled the stock since September. There is likely to be liquidity sitting above the descending trendline as multiple traders have been selling near the same resistance. Once this level breaks those sellers could get trapped and fresh buying may accelerate the move. The first upside zone could be around 1600–1650 followed by a possible attempt towards the previous high near 1750 if momentum strengthens. A successful retest of the broken trendline along with sustained trading above the 100 EMA would further strengthen the bullish structure. This consolidation is gradually reaching its final stage and one strong breakout could turn weeks of correction into a fresh bullish rally.
Now the real momentum can begin once Ather breaks and sustains above 1500–1520 with strong volume. Such a breakout would invalidate the series of lower highs and signal that buyers are finally overcoming the selling pressure that has controlled the stock since September. There is likely to be liquidity sitting above the descending trendline as multiple traders have been selling near the same resistance. Once this level breaks those sellers could get trapped and fresh buying may accelerate the move. The first upside zone could be around 1600–1650 followed by a possible attempt towards the previous high near 1750 if momentum strengthens. A successful retest of the broken trendline along with sustained trading above the 100 EMA would further strengthen the bullish structure. This consolidation is gradually reaching its final stage and one strong breakout could turn weeks of correction into a fresh bullish rally.

📌 Join Trading Community 👇
Telegram : 👉telegram.me/chartifyy
Instagram: 👉 instagram.com/chartifyig?igsi=Y2ZiODZtczZ2aDA=&utm_source=qr
Telegram : 👉telegram.me/chartifyy
Instagram: 👉 instagram.com/chartifyig?igsi=Y2ZiODZtczZ2aDA=&utm_source=qr
Declinazione di responsabilità
Le informazioni e le pubblicazioni non sono intese come, e non costituiscono, consulenza o raccomandazioni finanziarie, di investimento, di trading o di altro tipo fornite o approvate da TradingView. Per ulteriori informazioni, consultare i Termini di utilizzo.
📌 Join Trading Community 👇
Telegram : 👉telegram.me/chartifyy
Instagram: 👉 instagram.com/chartifyig?igsi=Y2ZiODZtczZ2aDA=&utm_source=qr
Telegram : 👉telegram.me/chartifyy
Instagram: 👉 instagram.com/chartifyig?igsi=Y2ZiODZtczZ2aDA=&utm_source=qr
Declinazione di responsabilità
Le informazioni e le pubblicazioni non sono intese come, e non costituiscono, consulenza o raccomandazioni finanziarie, di investimento, di trading o di altro tipo fornite o approvate da TradingView. Per ulteriori informazioni, consultare i Termini di utilizzo.