
Hello?
Traders, welcome.
If you "Follow", you can always get new information quickly.
Please also click "Boost".
Have a good day.
-------------------------------------
(ATOMBTC 1W chart)

The most important point is 0.0004 448 .
However, it is the range between 0.0005 440 and 0.0006 266, which is the range that can protect the rising power from the current price.
---------------------------------------
(ATOMUSDT 1W Chart)

The key is whether it can be supported at the HA-Low line and rise above the HA-High line.
(1D chart)
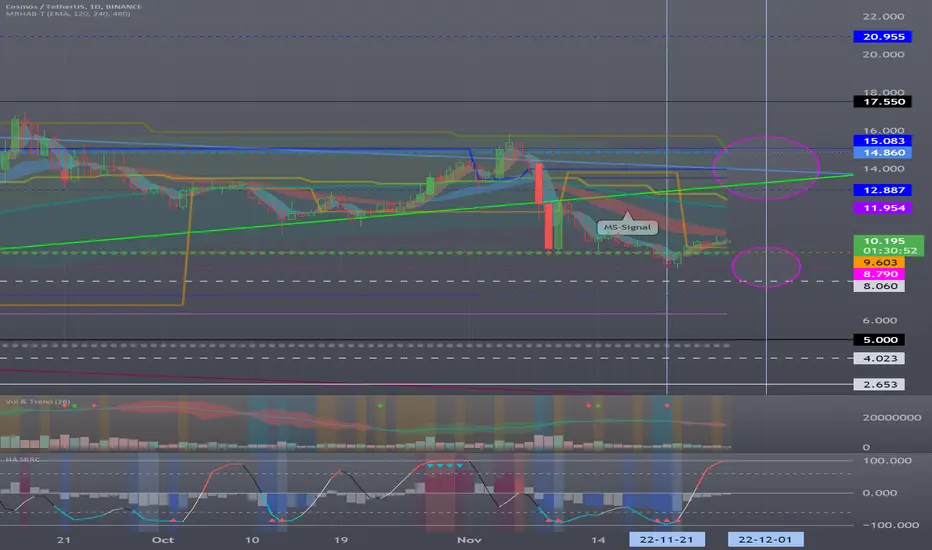
To turn into an uptrend, the price needs to stay above the HA-Low and above the MS-Signal indicator.
Therefore, the key question is whether this rise can rise above the MS-Signal indicator.
If not, you should check for support around 9.603.
If it falls below 8.060, there is a possibility of a decline to around 5.0, so you need to think about how to respond.
When the uptrend begins, it is the first resistance area, the 12.887-15.083 area.
-------------------------------------------------- -------------------------------------------
** All descriptions are for reference only and do not guarantee profit or loss in investment.
** If this chart is shared, you can use the indicators normally.
** The MRHAB-T indicator includes indicators that indicate points of support and resistance.
** SR_R_C indicators are displayed as StochRSI (line), RSI (columns), and CCI (bgcolor).
** The CCI indicator is displayed in the overbought section (CCI > +100) and oversold section (CCI < -100).
(Short-term Stop Loss can be said to be a point where profit or loss can be preserved or additional entry can be made by split trading. This is a short-term investment perspective.)
---------------------------------
Traders, welcome.
If you "Follow", you can always get new information quickly.
Please also click "Boost".
Have a good day.
-------------------------------------
(ATOMBTC 1W chart)
The most important point is 0.0004 448 .
However, it is the range between 0.0005 440 and 0.0006 266, which is the range that can protect the rising power from the current price.
---------------------------------------
(ATOMUSDT 1W Chart)
The key is whether it can be supported at the HA-Low line and rise above the HA-High line.
(1D chart)
To turn into an uptrend, the price needs to stay above the HA-Low and above the MS-Signal indicator.
Therefore, the key question is whether this rise can rise above the MS-Signal indicator.
If not, you should check for support around 9.603.
If it falls below 8.060, there is a possibility of a decline to around 5.0, so you need to think about how to respond.
When the uptrend begins, it is the first resistance area, the 12.887-15.083 area.
-------------------------------------------------- -------------------------------------------
** All descriptions are for reference only and do not guarantee profit or loss in investment.
** If this chart is shared, you can use the indicators normally.
** The MRHAB-T indicator includes indicators that indicate points of support and resistance.
** SR_R_C indicators are displayed as StochRSI (line), RSI (columns), and CCI (bgcolor).
** The CCI indicator is displayed in the overbought section (CCI > +100) and oversold section (CCI < -100).
(Short-term Stop Loss can be said to be a point where profit or loss can be preserved or additional entry can be made by split trading. This is a short-term investment perspective.)
---------------------------------

[Practical trading strategy using HA-MS and SBOD]
youtu.be/aceN1AttX1Y
[Binance Futures Message Channel]
t.me/readcryptobns
[업비트 메시지 채널]
t.me/readcryptoubt
youtu.be/aceN1AttX1Y
[Binance Futures Message Channel]
t.me/readcryptobns
[업비트 메시지 채널]
t.me/readcryptoubt
Pubblicazioni correlate
Declinazione di responsabilità
Le informazioni e le pubblicazioni non sono intese come, e non costituiscono, consulenza o raccomandazioni finanziarie, di investimento, di trading o di altro tipo fornite o approvate da TradingView. Per ulteriori informazioni, consultare i Termini di utilizzo.
[Practical trading strategy using HA-MS and SBOD]
youtu.be/aceN1AttX1Y
[Binance Futures Message Channel]
t.me/readcryptobns
[업비트 메시지 채널]
t.me/readcryptoubt
youtu.be/aceN1AttX1Y
[Binance Futures Message Channel]
t.me/readcryptobns
[업비트 메시지 채널]
t.me/readcryptoubt
Pubblicazioni correlate
Declinazione di responsabilità
Le informazioni e le pubblicazioni non sono intese come, e non costituiscono, consulenza o raccomandazioni finanziarie, di investimento, di trading o di altro tipo fornite o approvate da TradingView. Per ulteriori informazioni, consultare i Termini di utilizzo.