
On the Daily Time Frame, ATOMUSDT has taken support from the 20 DEMA and after halting there for 9 days, it formed a strong bullish candle yesterday.
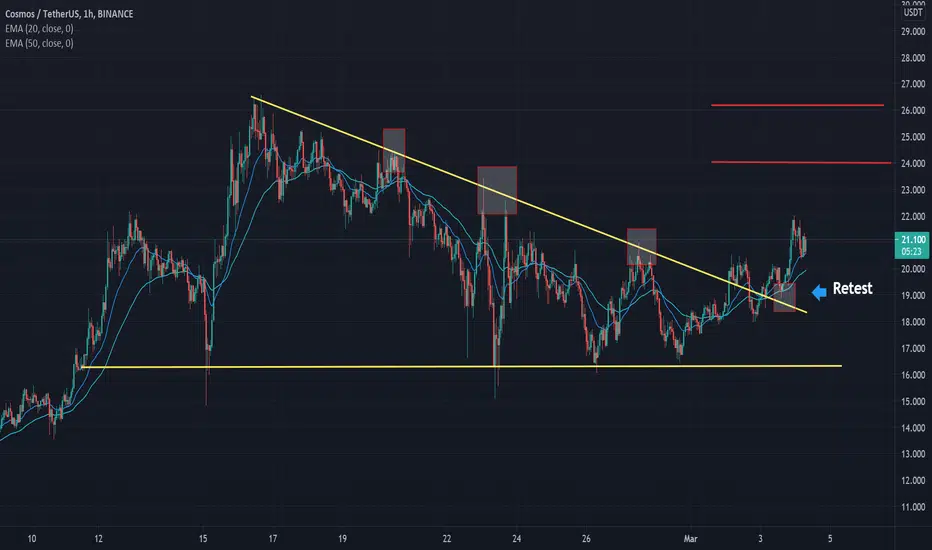
On the Hourly Time Frame, ATOMUSDT has given a breakout from the Bull Descending Triangle wherein it has been trading in that range for the past 18 days.
Key Levels to watch out:-
The supports to the lower side is present at $18.4 followed by $16.4.
On the higher side, it can face resistance at $24 followed by $26.2.
On the Hourly Time Frame, ATOMUSDT has given a breakout from the Bull Descending Triangle wherein it has been trading in that range for the past 18 days.
Key Levels to watch out:-
The supports to the lower side is present at $18.4 followed by $16.4.
On the higher side, it can face resistance at $24 followed by $26.2.

Declinazione di responsabilità
Le informazioni e le pubblicazioni non sono intese come, e non costituiscono, consulenza o raccomandazioni finanziarie, di investimento, di trading o di altro tipo fornite o approvate da TradingView. Per ulteriori informazioni, consultare i Termini di utilizzo.
Declinazione di responsabilità
Le informazioni e le pubblicazioni non sono intese come, e non costituiscono, consulenza o raccomandazioni finanziarie, di investimento, di trading o di altro tipo fornite o approvate da TradingView. Per ulteriori informazioni, consultare i Termini di utilizzo.