

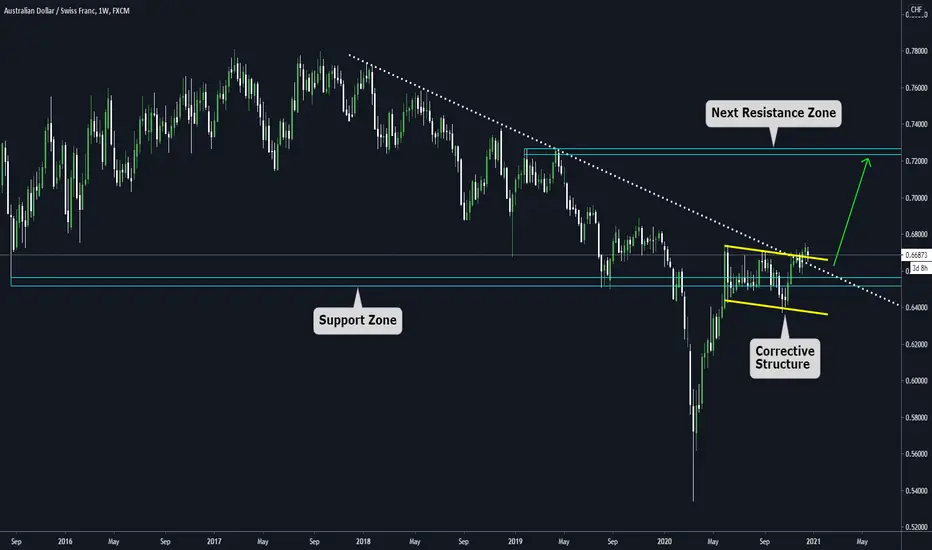
Let's take a look at the weekly chart on AUDCHF.
We have 3 relevant items to pay attention to
a) Broken descending trendline.
b) The price above a Huge support zone.
c) A massive Flag pattern on the edge of the broken descending trendline.
From a technical perspective, a Flag pattern is considered a continuation structure, which means that we have a sideways movement during a period of time, only for the price to keep going in the previous direction after the breakout.
We have 3 relevant items to pay attention to
a) Broken descending trendline.
b) The price above a Huge support zone.
c) A massive Flag pattern on the edge of the broken descending trendline.
From a technical perspective, a Flag pattern is considered a continuation structure, which means that we have a sideways movement during a period of time, only for the price to keep going in the previous direction after the breakout.

Declinazione di responsabilità
Le informazioni e le pubblicazioni non sono intese come, e non costituiscono, consulenza o raccomandazioni finanziarie, di investimento, di trading o di altro tipo fornite o approvate da TradingView. Per ulteriori informazioni, consultare i Termini di utilizzo.
Declinazione di responsabilità
Le informazioni e le pubblicazioni non sono intese come, e non costituiscono, consulenza o raccomandazioni finanziarie, di investimento, di trading o di altro tipo fornite o approvate da TradingView. Per ulteriori informazioni, consultare i Termini di utilizzo.