

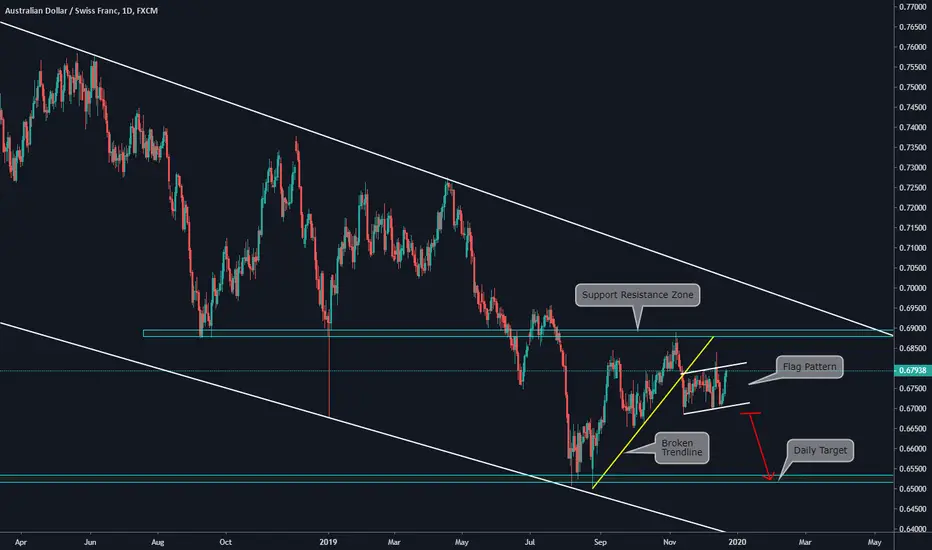
Use this as a guide to develop your personal view of the chart:
Main items we can see on the daily chart:
a) Currently, the price is on a Flag Pattern formation (continuation structure)
b) Before the Flag Pattern, the price broke the ascending trendline (Bullish Weakness)
c)We can see a clear Support/Resistance zone on the chart where the price was rejected
d)Our forecast for AUDCHF is that: IF price breaks below the Flag Pattern we will consider that a new bearish movement has started
e)Our Target will be the next support zone (Daily Target)
Main items we can see on the daily chart:
a) Currently, the price is on a Flag Pattern formation (continuation structure)
b) Before the Flag Pattern, the price broke the ascending trendline (Bullish Weakness)
c)We can see a clear Support/Resistance zone on the chart where the price was rejected
d)Our forecast for AUDCHF is that: IF price breaks below the Flag Pattern we will consider that a new bearish movement has started
e)Our Target will be the next support zone (Daily Target)

Declinazione di responsabilità
Le informazioni e le pubblicazioni non sono intese come, e non costituiscono, consulenza o raccomandazioni finanziarie, di investimento, di trading o di altro tipo fornite o approvate da TradingView. Per ulteriori informazioni, consultare i Termini di utilizzo.
Declinazione di responsabilità
Le informazioni e le pubblicazioni non sono intese come, e non costituiscono, consulenza o raccomandazioni finanziarie, di investimento, di trading o di altro tipo fornite o approvate da TradingView. Per ulteriori informazioni, consultare i Termini di utilizzo.