
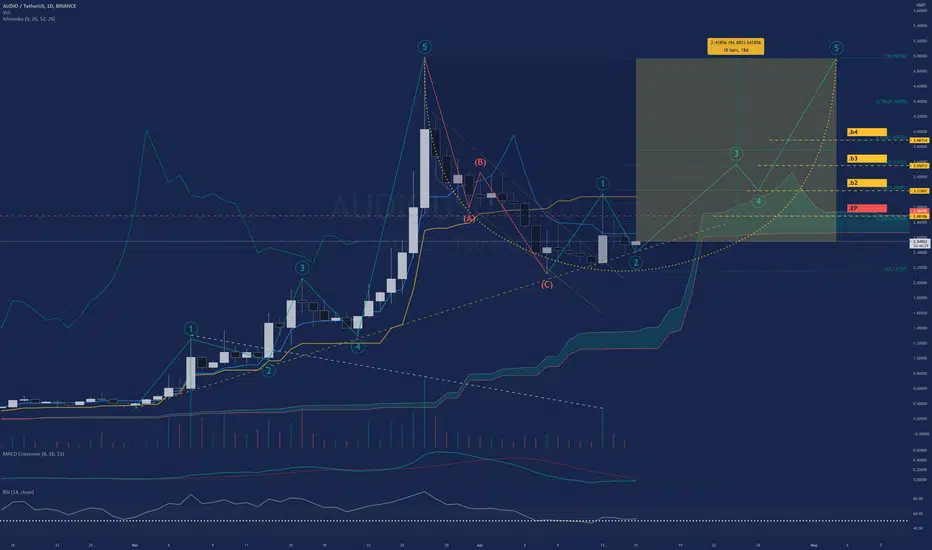
This is a daily chart for Audius $AUDIO.
I've traded AUDIO plenty of times these months, always been very profitable but in this occasion made a mistake getting greedy on the April 12th breakout candle. I had scalped it twice and took profit every time it retraced and reentered after. I should´ve seen the decreasing volume on the histogram (white segmented line) coming and was left hodling the bag.
But the resulting price action moving towards the upper trendline of the flag turned out forming a RB pattern.
I expect this to range maybe for 2-3 days before actually resuming it's climb and start a parabolic move to close the cup.
I'm still in play...
More ranging expected at every highlighted FIB level.
AUDIO should break $5USD with the completion of this move.
I've traded
AUDIO plenty of times these months, always been very profitable but in this occasion made a mistake getting greedy on the April 12th breakout candle. I had scalped it twice and took profit every time it retraced and reentered after. I should´ve seen the decreasing volume on the histogram (white segmented line) coming and was left hodling the bag.But the resulting price action moving towards the upper trendline of the flag turned out forming a RB pattern.
I expect this to range maybe for 2-3 days before actually resuming it's climb and start a parabolic move to close the cup.
I'm still in play...
More ranging expected at every highlighted FIB level.
AUDIO should break $5USD with the completion of this move.Trade attivo
Downtrend on AUDIO turned into a 5 wave ABCDE which deepens the RB pattern but doesn't change the overall idea. Along with this, the completion of a RB or C&H pattern will be more explosive than it was.
Declinazione di responsabilità
Le informazioni e le pubblicazioni non sono intese come, e non costituiscono, consulenza o raccomandazioni finanziarie, di investimento, di trading o di altro tipo fornite o approvate da TradingView. Per ulteriori informazioni, consultare i Termini di utilizzo.
Declinazione di responsabilità
Le informazioni e le pubblicazioni non sono intese come, e non costituiscono, consulenza o raccomandazioni finanziarie, di investimento, di trading o di altro tipo fornite o approvate da TradingView. Per ulteriori informazioni, consultare i Termini di utilizzo.