

AUDNZD – Liquidity Expansion Toward 1.30–1.35? RBA vs RBNZ Macro
Opening Hook
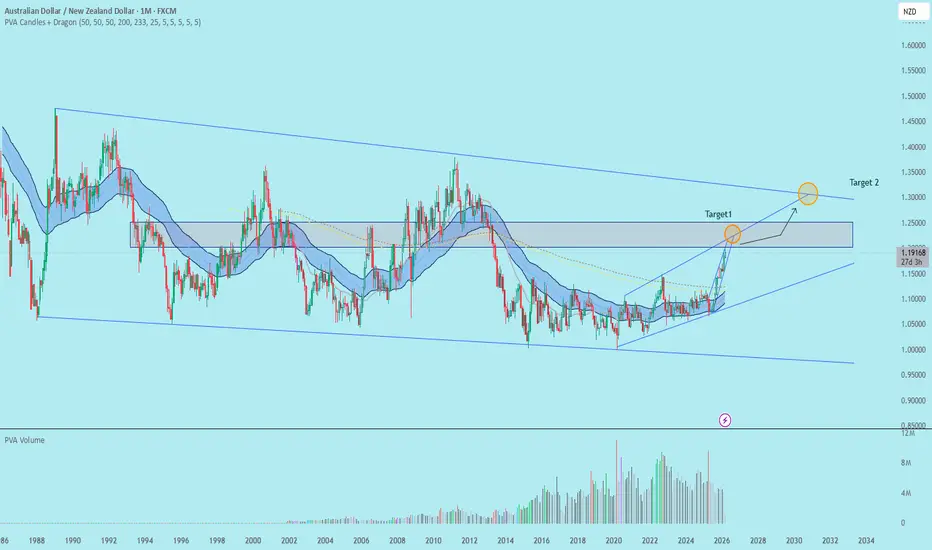
AUDNZD recently broke above the 1.19 structural resistance, signaling the potential start of a new bullish expansion phase.
Macro divergence between RBA and RBNZ, combined with commodity strength, could drive the pair toward higher liquidity zones in the coming cycles.
Key Levels to Watch
Support
1.19 – recent breakout level
1.17–1.18 – structural support zone
Resistance
1.22–1.23 – first expansion zone
1.26–1.27 – macro resistance
1.30 – psychological level
Above 1.30 there is historical liquidity extending toward 1.34–1.36.
Market Structure
On the higher timeframes, AUDNZD formed a large accumulation base between 1.03 and 1.19 over several years.
Key elements:
• Major bottom formed in 2022 around 1.03
• Higher highs and higher lows since 2023
• Structural breakout above 1.19
This suggests the pair may be transitioning from accumulation into expansion.
Macro Drivers
Several macro factors currently support AUD relative to NZD:
RBA monetary policy remains relatively firm compared to the more accommodative stance of the RBNZ.
Australia also benefits from stronger exposure to global commodities, while New Zealand's economy is more sensitive to agricultural demand cycles.
Geopolitical instability and potential commodity price shocks could further strengthen commodity-linked currencies like AUD.
Possible Expansion Path
A realistic medium-term path could develop in stages:
1.19 → consolidation
1.22 → breakout attempt
1.26 → macro resistance test
1.30 → psychological barrier
1.34–1.36 → long-term liquidity zone
The move would likely occur through waves rather than a straight trend.
Risk Scenario
The bullish structure weakens if price loses 1.17, which could trigger a deeper retracement toward 1.15 before continuation.
Conclusion
As long as price holds above 1.19, AUDNZD maintains a bullish macro structure.
The pair may target 1.26–1.30 in the medium term, with a possible extension toward 1.34–1.36 if macro divergence and commodity strength persist.
AUDNZD recently broke above the 1.19 structural resistance, signaling the potential start of a new bullish expansion phase.
Macro divergence between RBA and RBNZ, combined with commodity strength, could drive the pair toward higher liquidity zones in the coming cycles.
Key Levels to Watch
Support
1.19 – recent breakout level
1.17–1.18 – structural support zone
Resistance
1.22–1.23 – first expansion zone
1.26–1.27 – macro resistance
1.30 – psychological level
Above 1.30 there is historical liquidity extending toward 1.34–1.36.
Market Structure
On the higher timeframes, AUDNZD formed a large accumulation base between 1.03 and 1.19 over several years.
Key elements:
• Major bottom formed in 2022 around 1.03
• Higher highs and higher lows since 2023
• Structural breakout above 1.19
This suggests the pair may be transitioning from accumulation into expansion.
Macro Drivers
Several macro factors currently support AUD relative to NZD:
RBA monetary policy remains relatively firm compared to the more accommodative stance of the RBNZ.
Australia also benefits from stronger exposure to global commodities, while New Zealand's economy is more sensitive to agricultural demand cycles.
Geopolitical instability and potential commodity price shocks could further strengthen commodity-linked currencies like AUD.
Possible Expansion Path
A realistic medium-term path could develop in stages:
1.19 → consolidation
1.22 → breakout attempt
1.26 → macro resistance test
1.30 → psychological barrier
1.34–1.36 → long-term liquidity zone
The move would likely occur through waves rather than a straight trend.
Risk Scenario
The bullish structure weakens if price loses 1.17, which could trigger a deeper retracement toward 1.15 before continuation.
Conclusion
As long as price holds above 1.19, AUDNZD maintains a bullish macro structure.
The pair may target 1.26–1.30 in the medium term, with a possible extension toward 1.34–1.36 if macro divergence and commodity strength persist.
Nota
At 1.208, AUDNZD still supports the broader bullish view. As long as price holds above 1.2000–1.2020, the pair remains structurally positioned for another move into 1.2100–1.2150, with 1.2250 still possible if bullish momentum continues. A clean break below 1.2000 would be the first sign that upside pressure is fading.Trade attivo
Target 1 successfully reached.
Declinazione di responsabilità
Le informazioni e le pubblicazioni non sono intese come, e non costituiscono, consulenza o raccomandazioni finanziarie, di investimento, di trading o di altro tipo fornite o approvate da TradingView. Per ulteriori informazioni, consultare i Termini di utilizzo.
Declinazione di responsabilità
Le informazioni e le pubblicazioni non sono intese come, e non costituiscono, consulenza o raccomandazioni finanziarie, di investimento, di trading o di altro tipo fornite o approvate da TradingView. Per ulteriori informazioni, consultare i Termini di utilizzo.