

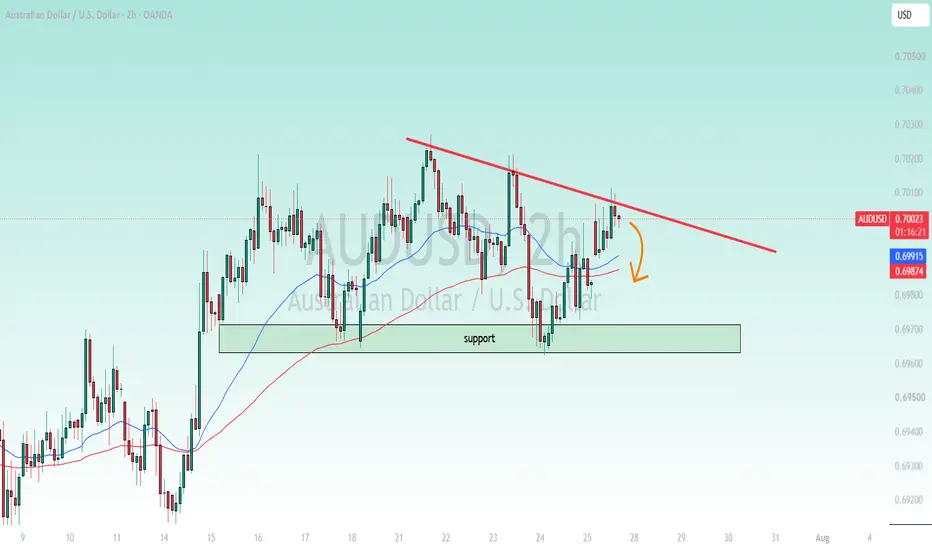
Looking at the technical chart, AUDUSD is currently trading just below a descending trendline, which has repeatedly capped upside momentum — a clear sign that sellers are still lurking every time price attempts to push higher. What's notable is that price has tested this descending resistance line multiple times, but each breakout attempt has been rejected, with successive highs coming in lower than the last.
This kind of price action tends to leave buyers "let down" after betting on a breakout that never comes. The repeated failure to close above the descending trend — despite multiple attempts — suggests buyers are gradually losing steam, rather than building enough momentum for a genuine breakout.
This "lower high pressing against resistance" structure is often an early warning sign of a downward correction — and this time may be no exception. If price action continues to follow this pattern, AUDUSD could turn back down toward the 0.6970–0.6980 support zone (marked on the chart) in the short term, provided price doesn't close decisively above the descending resistance around the 0.7010–0.7020 zone. This will be the key price zone determining the pair's next direction.
This is just a personal view based on technical analysis, not investment advice. Always wait for confirmation signals before entering a trade and manage your risk carefully.
This kind of price action tends to leave buyers "let down" after betting on a breakout that never comes. The repeated failure to close above the descending trend — despite multiple attempts — suggests buyers are gradually losing steam, rather than building enough momentum for a genuine breakout.
This "lower high pressing against resistance" structure is often an early warning sign of a downward correction — and this time may be no exception. If price action continues to follow this pattern, AUDUSD could turn back down toward the 0.6970–0.6980 support zone (marked on the chart) in the short term, provided price doesn't close decisively above the descending resistance around the 0.7010–0.7020 zone. This will be the key price zone determining the pair's next direction.
This is just a personal view based on technical analysis, not investment advice. Always wait for confirmation signals before entering a trade and manage your risk carefully.
Trade chiuso: obiettivo raggiunto

📊 FX | Gold | Crypto
Turning charts into opportunities.
🔍 Volume Analysis
📈 Trend Forecasts
💡 Free Trading Ideas
🌍 Join our growing community:
t.me/+f_vI675IPrQ2N2Q1
Turning charts into opportunities.
🔍 Volume Analysis
📈 Trend Forecasts
💡 Free Trading Ideas
🌍 Join our growing community:
t.me/+f_vI675IPrQ2N2Q1
Pubblicazioni correlate
Declinazione di responsabilità
Le informazioni e le pubblicazioni non sono intese come, e non costituiscono, consulenza o raccomandazioni finanziarie, di investimento, di trading o di altro tipo fornite o approvate da TradingView. Per ulteriori informazioni, consultare i Termini di utilizzo.
📊 FX | Gold | Crypto
Turning charts into opportunities.
🔍 Volume Analysis
📈 Trend Forecasts
💡 Free Trading Ideas
🌍 Join our growing community:
t.me/+f_vI675IPrQ2N2Q1
Turning charts into opportunities.
🔍 Volume Analysis
📈 Trend Forecasts
💡 Free Trading Ideas
🌍 Join our growing community:
t.me/+f_vI675IPrQ2N2Q1
Pubblicazioni correlate
Declinazione di responsabilità
Le informazioni e le pubblicazioni non sono intese come, e non costituiscono, consulenza o raccomandazioni finanziarie, di investimento, di trading o di altro tipo fornite o approvate da TradingView. Per ulteriori informazioni, consultare i Termini di utilizzo.