Long
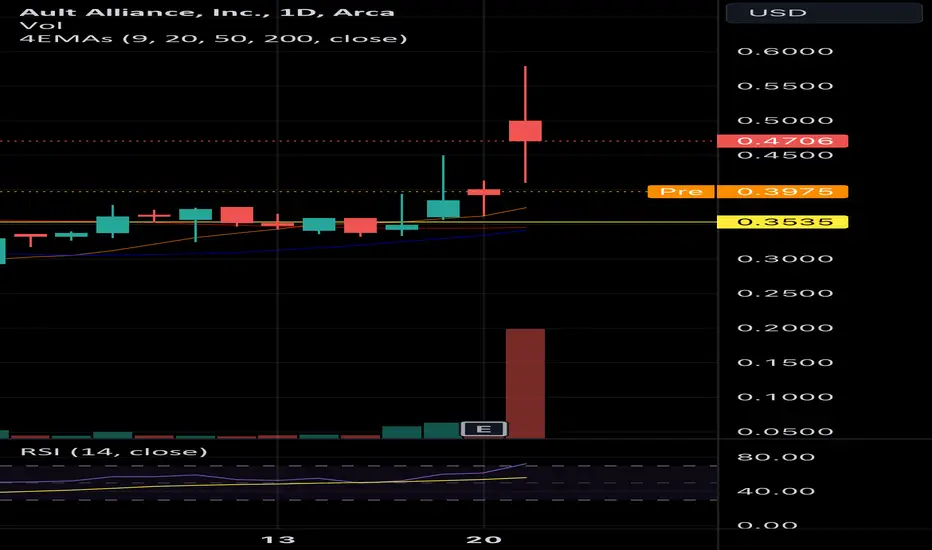
20 and 50 Golden Cross Daily
Certainly!
"When the 20-day moving average crosses above the 50-day moving average on a daily stock chart, it forms what is known as a 'golden cross.' This is generally considered a bullish signal by technical analysts and investors, indicating a potential trend reversal towards a bullish market. However, it's important to consider other factors and indicators to confirm the validity of this signal before making trading decisions.
For Ault stock, this golden cross is currently occurring, marking an event that hasn't happened in years."
"When the 20-day moving average crosses above the 50-day moving average on a daily stock chart, it forms what is known as a 'golden cross.' This is generally considered a bullish signal by technical analysts and investors, indicating a potential trend reversal towards a bullish market. However, it's important to consider other factors and indicators to confirm the validity of this signal before making trading decisions.
For Ault stock, this golden cross is currently occurring, marking an event that hasn't happened in years."

Declinazione di responsabilità
Le informazioni e le pubblicazioni non sono intese come, e non costituiscono, consulenza o raccomandazioni finanziarie, di investimento, di trading o di altro tipo fornite o approvate da TradingView. Per ulteriori informazioni, consultare i Termini di utilizzo.
Declinazione di responsabilità
Le informazioni e le pubblicazioni non sono intese come, e non costituiscono, consulenza o raccomandazioni finanziarie, di investimento, di trading o di altro tipo fornite o approvate da TradingView. Per ulteriori informazioni, consultare i Termini di utilizzo.