
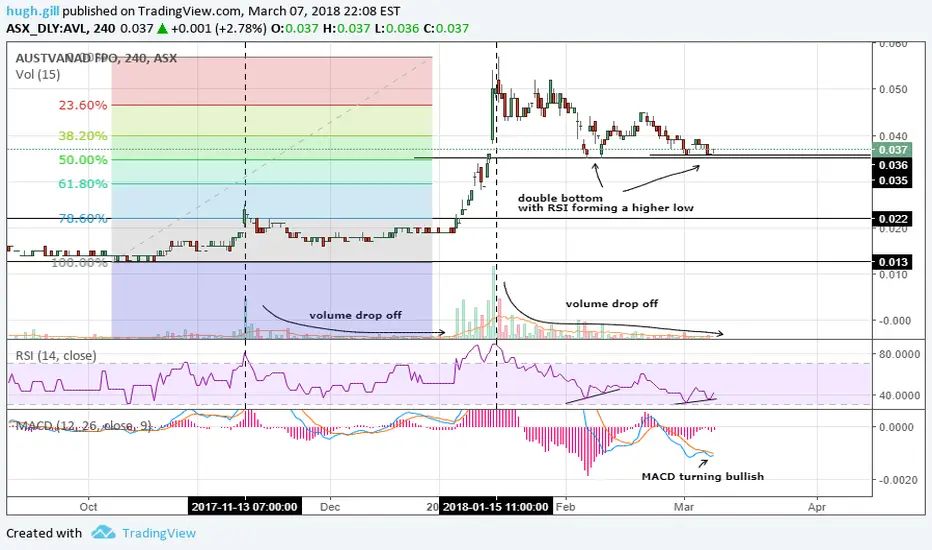
AVL has had a nice run up in price and has recently pulled back about 40% before finding support on the 50% FIB level..
Bullish Indicators:
Double Bottom on 50% Fib
Higher Low on 50% Fib
RSI creating higher low on 4 hour chart (showing strength)
Monthly RSI cooled off.
Volume has dropped off significantly. (usually see this before a big pump)
I noticed this exact set up on another chart KRC screenshot below

Entry .036 - .037
Target .065
Stoploss .034
Stoploss
Bullish Indicators:
Double Bottom on 50% Fib
Higher Low on 50% Fib
RSI creating higher low on 4 hour chart (showing strength)
Monthly RSI cooled off.
Volume has dropped off significantly. (usually see this before a big pump)
I noticed this exact set up on another chart KRC screenshot below
Entry .036 - .037
Target .065
Stoploss .034
Stoploss
Trade attivo
KRC Weekly RSI CooloffAVL Weekly RSI Cooloff

Pubblicazioni correlate
Declinazione di responsabilità
Le informazioni e le pubblicazioni non sono intese come, e non costituiscono, consulenza o raccomandazioni finanziarie, di investimento, di trading o di altro tipo fornite o approvate da TradingView. Per ulteriori informazioni, consultare i Termini di utilizzo.
Pubblicazioni correlate
Declinazione di responsabilità
Le informazioni e le pubblicazioni non sono intese come, e non costituiscono, consulenza o raccomandazioni finanziarie, di investimento, di trading o di altro tipo fornite o approvate da TradingView. Per ulteriori informazioni, consultare i Termini di utilizzo.