
Disclaimer:
This analysis is for educational purposes only. I am not a SEBI-registered advisor. This is not financial advice.
Symbol: AXISBANK (NSE)
Date Observed: 18 August 2023
Time Frame: 15-Minute Chart
Study Used: Gann Square of 9 (Normal Price Capacity)
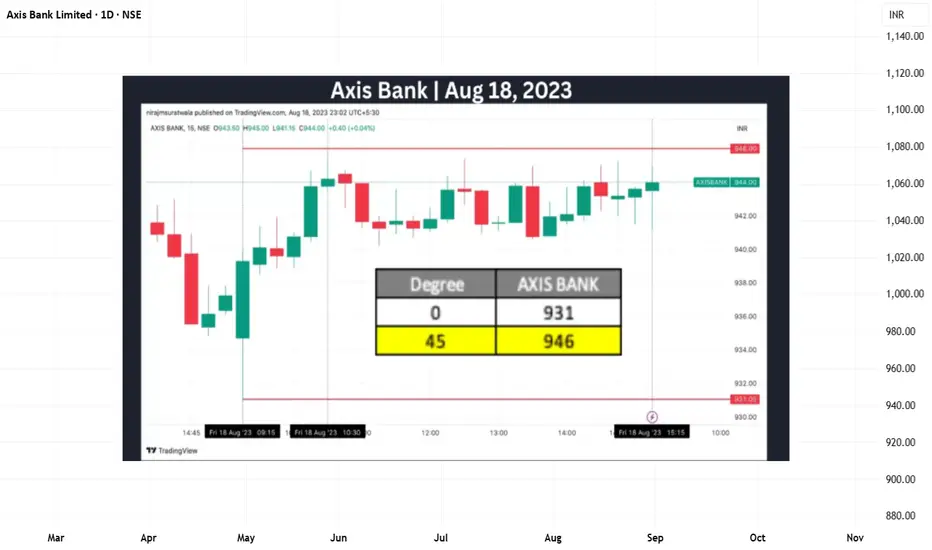
This idea shares a historical intraday observation where Axis Bank’s price movement stayed within a normal Square of 9 price range, followed by a visible reaction after price–time alignment.
📊 Market Context & Reference Selection
🔢 Square of 9 Levels Observed
⏱️ Observed Price–Time Behavior
📘 Educational Takeaways
📌 Shared strictly for educational and historical chart-study purposes.
#AxisBank #GannSquareOf9 #WDGann #IntradayAnalysis #MarketEducation #PriceTime #TechnicalAnalysis #RuleBasedStudy
This analysis is for educational purposes only. I am not a SEBI-registered advisor. This is not financial advice.
Symbol: AXISBANK (NSE)
Date Observed: 18 August 2023
Time Frame: 15-Minute Chart
Study Used: Gann Square of 9 (Normal Price Capacity)
This idea shares a historical intraday observation where Axis Bank’s price movement stayed within a normal Square of 9 price range, followed by a visible reaction after price–time alignment.
📊 Market Context & Reference Selection
- During the session, price showed gradual upward movement starting later in the morning.
- In upward conditions, the low of the reference candle (~931) was treated as the 0-degree level, following commonly used Gann principles.
- From this reference, the Square of 9 was applied to observe expected intraday price expansion.
- This process focuses on structure and measurement, not forecasting.
🔢 Square of 9 Levels Observed
- Based on the selected reference:
- 0 Degree: ~931
- 45 Degree (Observed Normal Upside Capacity): ~946
- The 45-degree level is monitored as a potential reaction zone when reached early in the session.
⏱️ Observed Price–Time Behavior
- Price moved upward from the reference area and interacted with the 45-degree zone around 10:30 AM.
- This interaction occurred well before typical intraday time thresholds.
- After reaching this zone, the market showed temporary selling pressure.
- Similar reactions have been historically observed when normal intraday capacity is completed early.
- The entire session’s range remained within this capacity, reflecting balanced price behavior.
📘 Educational Takeaways
- Importance of selecting a valid 0-degree reference
- Measuring normal intraday price range using Square of 9
- Observing time alignment along with price levels
- Recognizing reaction zones rather than fixed turning points
- Maintaining a disciplined, rule-based analytical approach
- This example illustrates how price-time tools can be used to interpret intraday behavior objectively.
📌 Shared strictly for educational and historical chart-study purposes.
#AxisBank #GannSquareOf9 #WDGann #IntradayAnalysis #MarketEducation #PriceTime #TechnicalAnalysis #RuleBasedStudy

Pubblicazioni correlate
Declinazione di responsabilità
Le informazioni e le pubblicazioni non sono intese come, e non costituiscono, consulenza o raccomandazioni finanziarie, di investimento, di trading o di altro tipo fornite o approvate da TradingView. Per ulteriori informazioni, consultare i Termini di utilizzo.
Pubblicazioni correlate
Declinazione di responsabilità
Le informazioni e le pubblicazioni non sono intese come, e non costituiscono, consulenza o raccomandazioni finanziarie, di investimento, di trading o di altro tipo fornite o approvate da TradingView. Per ulteriori informazioni, consultare i Termini di utilizzo.