
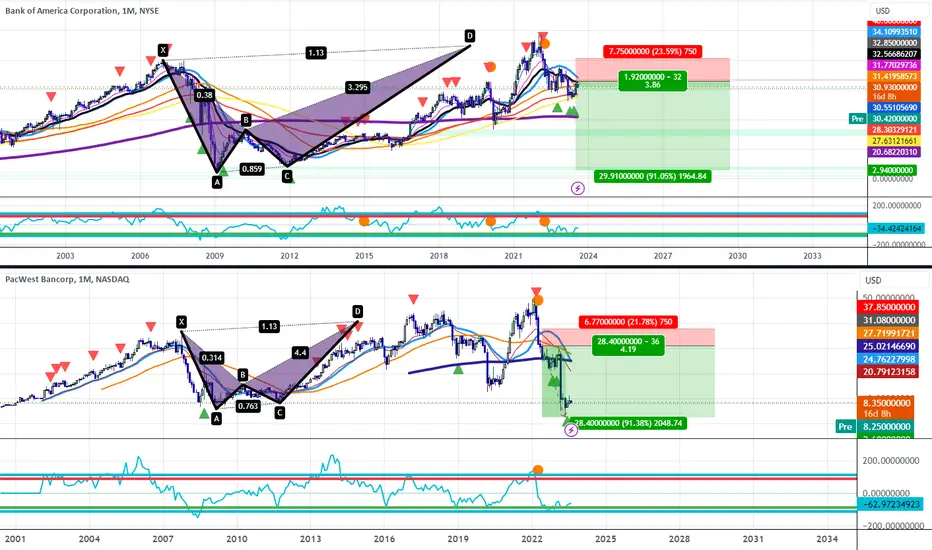
When comparing the price action between BAC and PACW, it can be seen that both stocks exhibit the same price action, which is a Rising and Broadening Structure leading into the PCZ of a Bearish Alt-Bat, which all eventually came to a halt upon getting Bearish PPO Confirmation. This led to a breaking of the 21-Month SMA before ultimately flushing down to all-time lows after months of treating the 21-Month SMA levels as resistance.
The same price action can be seen on Bank of America; it is just 1 step behind PACW at this point in time, which is the flipping of the 21-SMA into resistance. The next step would be for it to crash below the 2009 lows.
The same price action can be seen on Bank of America; it is just 1 step behind PACW at this point in time, which is the flipping of the 21-SMA into resistance. The next step would be for it to crash below the 2009 lows.
Trade attivo

Pubblicazioni correlate
Declinazione di responsabilità
Le informazioni e le pubblicazioni non sono intese come, e non costituiscono, consulenza o raccomandazioni finanziarie, di investimento, di trading o di altro tipo fornite o approvate da TradingView. Per ulteriori informazioni, consultare i Termini di utilizzo.
Pubblicazioni correlate
Declinazione di responsabilità
Le informazioni e le pubblicazioni non sono intese come, e non costituiscono, consulenza o raccomandazioni finanziarie, di investimento, di trading o di altro tipo fornite o approvate da TradingView. Per ulteriori informazioni, consultare i Termini di utilizzo.