
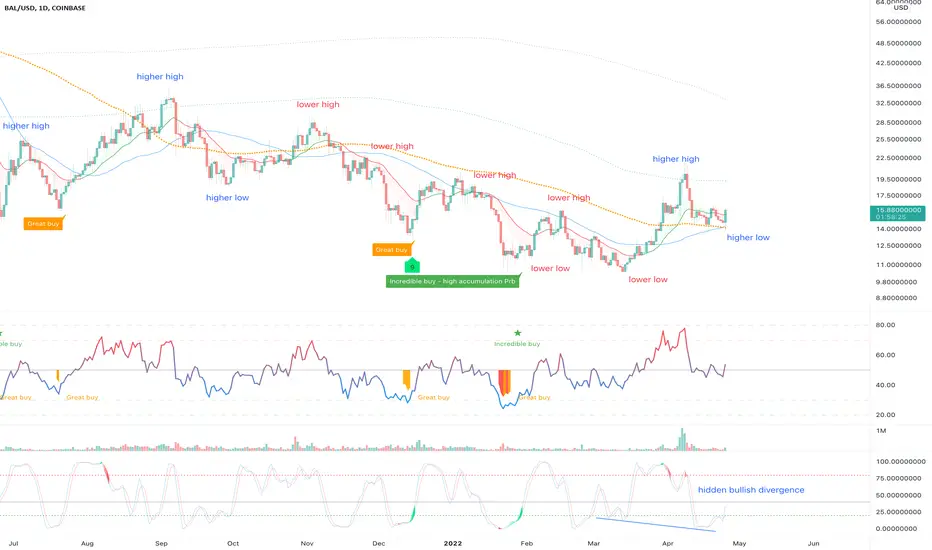
On the above daily chart price action has corrected over 80% since May of last year. Now is an excellent time to be long. Why?
1) The ‘incredible buy’ signal printed.
2) Trend reversal, higher highs / higher lows are printing in price action and RSI.
3) Hidden bullish divergence. This is defined by price action printing a higher high at the same time an oscillator prints a lower low, namely stochastic RSI.
4) Lastly on the weekly BTC pair price action breaks through the 21-week EMA support (below).
Is it possible price action falls further? Sure.
Is it probable? No.
Target? $100, at first. This is derived from the falling wedge breakout as shown on the 10-day chart below. The flagpole of the wedge measures the target.
Good luck!
Ww
Weekly BTC pair

10-chart

1) The ‘incredible buy’ signal printed.
2) Trend reversal, higher highs / higher lows are printing in price action and RSI.
3) Hidden bullish divergence. This is defined by price action printing a higher high at the same time an oscillator prints a lower low, namely stochastic RSI.
4) Lastly on the weekly BTC pair price action breaks through the 21-week EMA support (below).
Is it possible price action falls further? Sure.
Is it probable? No.
Target? $100, at first. This is derived from the falling wedge breakout as shown on the 10-day chart below. The flagpole of the wedge measures the target.
Good luck!
Ww
Weekly BTC pair
10-chart
Trade attivo
Excellent moment as price action tests the golden ratio. First test point $27.Nota
On the daily chart price action is absolutely being squeezed into the corner of current wedge pattern. If a breakout is confirmed it should result in a 70% upside move.The story is similar on the BTC pair,

Declinazione di responsabilità
Le informazioni e le pubblicazioni non sono intese come, e non costituiscono, consulenza o raccomandazioni finanziarie, di investimento, di trading o di altro tipo fornite o approvate da TradingView. Per ulteriori informazioni, consultare i Termini di utilizzo.
Declinazione di responsabilità
Le informazioni e le pubblicazioni non sono intese come, e non costituiscono, consulenza o raccomandazioni finanziarie, di investimento, di trading o di altro tipo fornite o approvate da TradingView. Per ulteriori informazioni, consultare i Termini di utilizzo.