
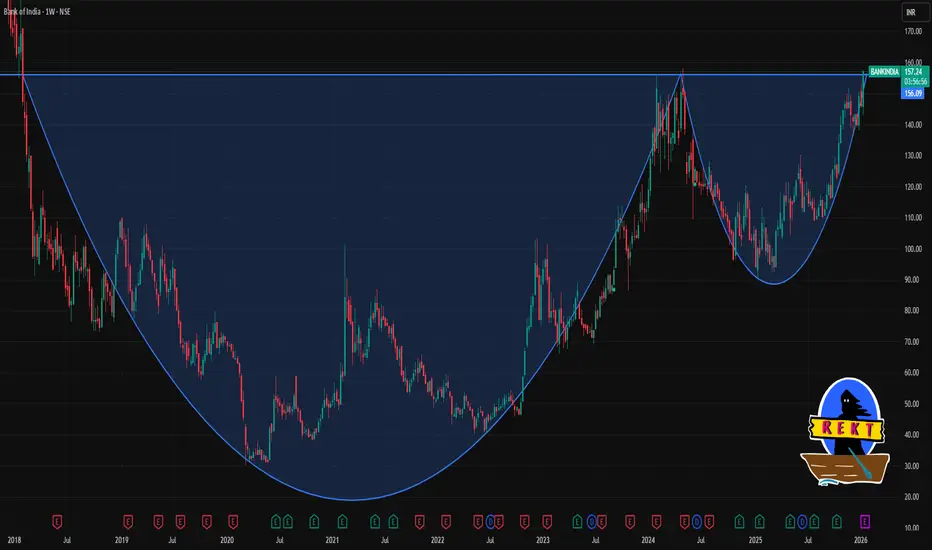
📈 Current Price Context (as of latest available)
Bank of India is trading in the range of ~₹152–157 recently on NSE.
🔁 Weekly Trend / Technical Signals
On TradingView’s aggregated technicals, the 1‑week rating shows a Strong Buy trend, indicating bullish momentum on the weekly timeframe.
📊 Key Levels to Watch (Weekly)
🔹 Resistance (Upside)
1. ~₹158–163 — near recent pivot R2/R3 zones seen on pivot studies.
2. ~₹165–168+ — upper circuit and extended resistance from broader pivot calculations.
If the weekly close stays above ₹158 and builds momentum, higher resistance targets toward ₹165–168 could be tested.
🔸 Support (Downside)
1. ~₹148–150 — immediate support from short‑term pivot and recent intraday bounce zone.
2. ~₹143–145 — next support aligned with 20‑ to 50‑day moving averages and volume support zone.
3. ~₹139–140 — key weekly support; breaking this may open room for deeper pullback.
A weekly close below ~₹143–145 could signal weakening in the short‑term uptrend, and a break under ₹139 may turn the bias more bearish.

Contact Knowledgehub for a detailed consultation: Dm on WhatsApp: [wa.link/a2o0kz]-
Phone No: [+91 93102 26243]-
Email: [tradingviewknowledgehub@gmail.com]---
-- Let’s achieve success together!
Phone No: [+91 93102 26243]-
Email: [tradingviewknowledgehub@gmail.com]---
-- Let’s achieve success together!
Pubblicazioni correlate
Declinazione di responsabilità
Le informazioni e le pubblicazioni non sono intese come, e non costituiscono, consulenza o raccomandazioni finanziarie, di investimento, di trading o di altro tipo fornite o approvate da TradingView. Per ulteriori informazioni, consultare i Termini di utilizzo.