
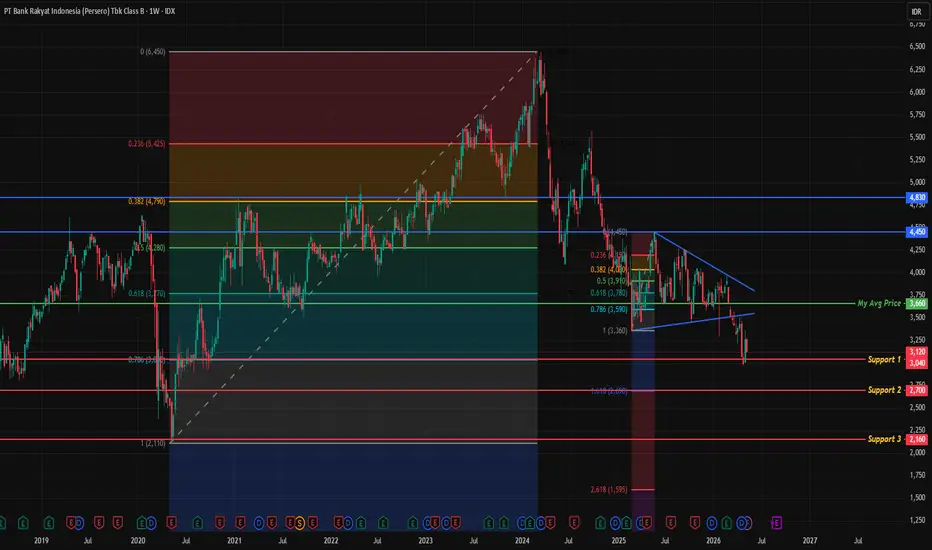
Current Price: ±3,120
Average Buy Position: 3,660
Focus of this analysis:
* support identification,
* Fibonacci structure,
* and the symmetrical triangle breakdown.
---
# Market Structure
BBRI remains under medium-term bearish pressure.
From the updated chart:
* the symmetrical triangle has already broken down,
* key horizontal support failed to hold,
* and price is now trading below my average buy position at 3,660.
The 3,660 area has now turned into:
* a psychological resistance,
* a supply zone,
* and a trapped buyer area.
As long as price stays below this level on a weekly closing basis, the market structure is still considered weak.
---
# Fibonacci Structure
Using the major swing:
* Low: 2,110
* High: 6,450
Key Fibonacci levels:
* 0.5 → 4,280
* 0.618 → 3,760
* 0.786 → 3,160
* 1.0 → 2,110
Current price has already broken below the 0.786 retracement level, which is often considered the final support zone before a medium-term bullish structure weakens significantly.
This suggests the market is entering a:
> distribution and valuation repricing phase.
---
# Symmetrical Triangle Breakdown
The previous structure formed:
* consistent lower highs,
* while buyers defended horizontal support,
* until the support finally broke.
Technically, a symmetrical triangle after a downtrend tends to act as a bearish continuation pattern.
That is currently what BBRI is showing.
---
# Key Support Areas
## Support 1 — 3,040
Nearest support zone.
Potential:
* short-term technical bounce,
* temporary reaction area.
However, if weekly closes remain below this level, downside risk increases further.
---
## Support 2 — 2,700
This is the first area that starts to look attractive for:
* long-term accumulation,
* gradual scaling,
* and investment positioning.
Why?
Because this area aligns with:
* historical support,
* Fibonacci extension confluence,
* and increasingly discounted valuation levels.
---
## Support 3 — 2,160
This is considered a deep value zone.
Such levels usually appear during:
* panic selling,
* major foreign outflows,
* or broader market risk-off conditions.
Ironically, these are often the zones where long-term institutional accumulation begins.
---
# Valuation Perspective
Fundamentally, BBRI is starting to look relatively cheap.
Current estimates:
* PER around 7–9x,
* PBV around 1.4–1.6x,
* both below historical averages.
Most analyst target prices still range around:
* 4,400–4,900.
This means the market is already pricing in a significant amount of fear and pessimism.
---
# Conclusion
Technically:
* the trend remains bearish,
* the triangle pattern has broken down,
* and key support levels have failed.
However, from a valuation perspective:
BBRI is gradually entering a more attractive zone for long-term investors.
The more rational approach right now is:
* avoid aggressive all-in buying,
* scale in gradually,
* and wait for structural reclaim confirmation for safer positioning.
As long as price remains below 3,660:
the market is still considered under pressure, and a full recovery has not yet been confirmed.
Average Buy Position: 3,660
Focus of this analysis:
* support identification,
* Fibonacci structure,
* and the symmetrical triangle breakdown.
---
# Market Structure
BBRI remains under medium-term bearish pressure.
From the updated chart:
* the symmetrical triangle has already broken down,
* key horizontal support failed to hold,
* and price is now trading below my average buy position at 3,660.
The 3,660 area has now turned into:
* a psychological resistance,
* a supply zone,
* and a trapped buyer area.
As long as price stays below this level on a weekly closing basis, the market structure is still considered weak.
---
# Fibonacci Structure
Using the major swing:
* Low: 2,110
* High: 6,450
Key Fibonacci levels:
* 0.5 → 4,280
* 0.618 → 3,760
* 0.786 → 3,160
* 1.0 → 2,110
Current price has already broken below the 0.786 retracement level, which is often considered the final support zone before a medium-term bullish structure weakens significantly.
This suggests the market is entering a:
> distribution and valuation repricing phase.
---
# Symmetrical Triangle Breakdown
The previous structure formed:
* consistent lower highs,
* while buyers defended horizontal support,
* until the support finally broke.
Technically, a symmetrical triangle after a downtrend tends to act as a bearish continuation pattern.
That is currently what BBRI is showing.
---
# Key Support Areas
## Support 1 — 3,040
Nearest support zone.
Potential:
* short-term technical bounce,
* temporary reaction area.
However, if weekly closes remain below this level, downside risk increases further.
---
## Support 2 — 2,700
This is the first area that starts to look attractive for:
* long-term accumulation,
* gradual scaling,
* and investment positioning.
Why?
Because this area aligns with:
* historical support,
* Fibonacci extension confluence,
* and increasingly discounted valuation levels.
---
## Support 3 — 2,160
This is considered a deep value zone.
Such levels usually appear during:
* panic selling,
* major foreign outflows,
* or broader market risk-off conditions.
Ironically, these are often the zones where long-term institutional accumulation begins.
---
# Valuation Perspective
Fundamentally, BBRI is starting to look relatively cheap.
Current estimates:
* PER around 7–9x,
* PBV around 1.4–1.6x,
* both below historical averages.
Most analyst target prices still range around:
* 4,400–4,900.
This means the market is already pricing in a significant amount of fear and pessimism.
---
# Conclusion
Technically:
* the trend remains bearish,
* the triangle pattern has broken down,
* and key support levels have failed.
However, from a valuation perspective:
BBRI is gradually entering a more attractive zone for long-term investors.
The more rational approach right now is:
* avoid aggressive all-in buying,
* scale in gradually,
* and wait for structural reclaim confirmation for safer positioning.
As long as price remains below 3,660:
the market is still considered under pressure, and a full recovery has not yet been confirmed.

Declinazione di responsabilità
Le informazioni e le pubblicazioni non sono intese come, e non costituiscono, consulenza o raccomandazioni finanziarie, di investimento, di trading o di altro tipo fornite o approvate da TradingView. Per ulteriori informazioni, consultare i Termini di utilizzo.
Declinazione di responsabilità
Le informazioni e le pubblicazioni non sono intese come, e non costituiscono, consulenza o raccomandazioni finanziarie, di investimento, di trading o di altro tipo fornite o approvate da TradingView. Per ulteriori informazioni, consultare i Termini di utilizzo.