
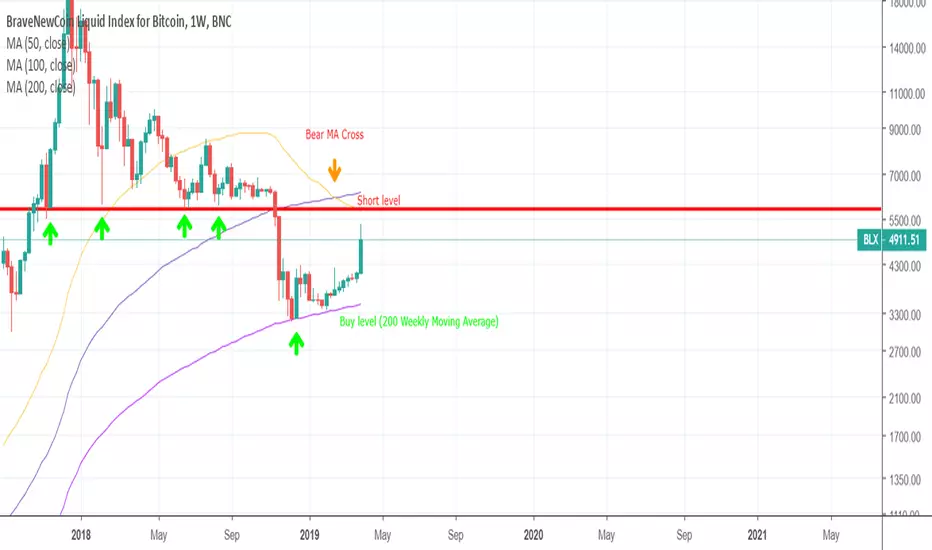
This is the Bitcoin weekly view (BLX chart).
We have seen that the 5800$ level acted as a good support until it was tested for the 5th time in november 2018. Now it is acting as huge resistance and it coincides with the 50 Weekly Moving Average, which also acts a resistance. Furthermore we have seen the bearish MA cross happen already (50 crossed down the 100). The long term support is at the 200 weekly Moving Average.
We have seen that the 5800$ level acted as a good support until it was tested for the 5th time in november 2018. Now it is acting as huge resistance and it coincides with the 50 Weekly Moving Average, which also acts a resistance. Furthermore we have seen the bearish MA cross happen already (50 crossed down the 100). The long term support is at the 200 weekly Moving Average.

Declinazione di responsabilità
Le informazioni e le pubblicazioni non sono intese come, e non costituiscono, consulenza o raccomandazioni finanziarie, di investimento, di trading o di altro tipo fornite o approvate da TradingView. Per ulteriori informazioni, consultare i Termini di utilizzo.
Declinazione di responsabilità
Le informazioni e le pubblicazioni non sono intese come, e non costituiscono, consulenza o raccomandazioni finanziarie, di investimento, di trading o di altro tipo fornite o approvate da TradingView. Per ulteriori informazioni, consultare i Termini di utilizzo.