
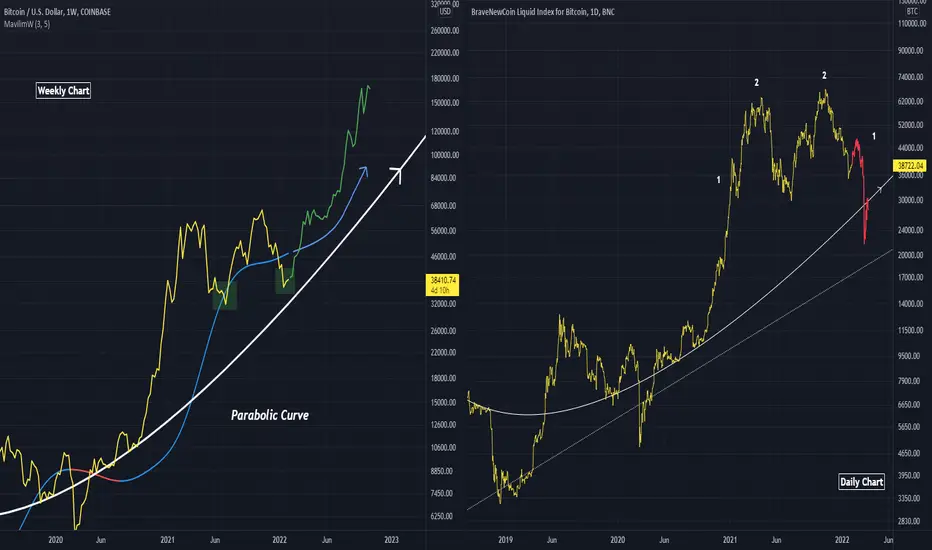
On the left I assume the Parabolic trend hodls, coupled with a double bottom , leading to price increase on the Weekly timeframe
On the right I assume a third breakdown under the same Parabolic trend occurs, as indicated by (1). This provides symmetry for the current formation and allows for the third dip.
Red pill, blue pill
On the right I assume a third breakdown under the same Parabolic trend occurs, as indicated by (1). This provides symmetry for the current formation and allows for the third dip.
Red pill, blue pill
Nota
The suggested peak (bars pattern) on the bull chart could just be the initial spike on the (1) move for the bears
Declinazione di responsabilità
Le informazioni e le pubblicazioni non sono intese come, e non costituiscono, consulenza o raccomandazioni finanziarie, di investimento, di trading o di altro tipo fornite o approvate da TradingView. Per ulteriori informazioni, consultare i Termini di utilizzo.
Declinazione di responsabilità
Le informazioni e le pubblicazioni non sono intese come, e non costituiscono, consulenza o raccomandazioni finanziarie, di investimento, di trading o di altro tipo fornite o approvate da TradingView. Per ulteriori informazioni, consultare i Termini di utilizzo.