
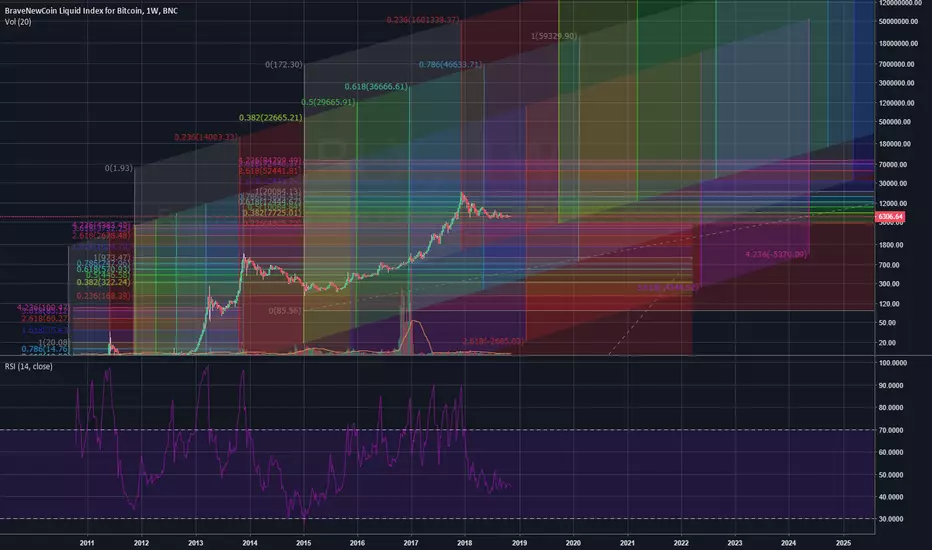
Greetings fellow traders. This is a remastered version of a graph from "Andbcoin": 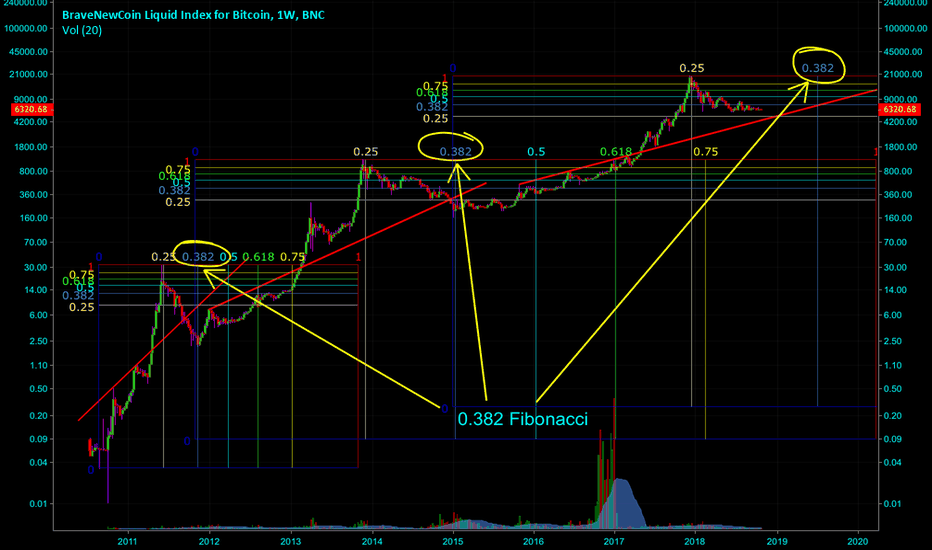
I have come to slightly different dates and price levels, which show 0.382 fib at 23 Sep 2019 to bring us a $4950/BTC bottom. The controversy of this graph is the fact that we have a bottom being very close to the next top in Feb 2020. What are your thoughts?
I have come to slightly different dates and price levels, which show 0.382 fib at 23 Sep 2019 to bring us a $4950/BTC bottom. The controversy of this graph is the fact that we have a bottom being very close to the next top in Feb 2020. What are your thoughts?
Nota
I've updated my chart with the very first fibonacchi box, starting from week 2 of Mt.Gox exchange. It shows some additional insights, for me in particular, the way price acts upon entering into 2.618 ratio line, which is about to happen in Feb 2019.
Nota
This is my guesstimate trend continuation, based on Fibonacci boxes. Very simple. I've put 32k top price, because the overall trend is getting leveled and I don't see it making any changes in the future. Mainstream wants blockchain, not bitcoin.

Pubblicazioni correlate
Declinazione di responsabilità
Le informazioni e le pubblicazioni non sono intese come, e non costituiscono, consulenza o raccomandazioni finanziarie, di investimento, di trading o di altro tipo fornite o approvate da TradingView. Per ulteriori informazioni, consultare i Termini di utilizzo.
Pubblicazioni correlate
Declinazione di responsabilità
Le informazioni e le pubblicazioni non sono intese come, e non costituiscono, consulenza o raccomandazioni finanziarie, di investimento, di trading o di altro tipo fornite o approvate da TradingView. Per ulteriori informazioni, consultare i Termini di utilizzo.