
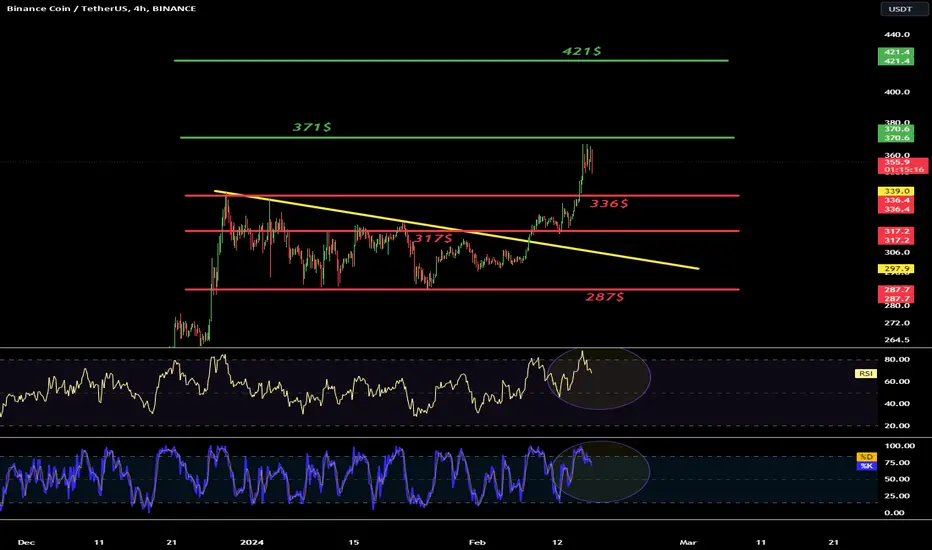
Please see the BNB to USDT chart in the 4-hour time frame. As you can see, the price has dynamically broken out of the local downward trend line.
After deploying the trend based fib extension tool, you can see a strong resistance at $371, and then another very strong one at $421.
Looking the other way, there is support at $336, another at $317, and then at $287.
When we look at the RSI indicator and the STOCH indicator, we will see the beginning of a recovery movement with room for a larger decline.
After deploying the trend based fib extension tool, you can see a strong resistance at $371, and then another very strong one at $421.
Looking the other way, there is support at $336, another at $317, and then at $287.
When we look at the RSI indicator and the STOCH indicator, we will see the beginning of a recovery movement with room for a larger decline.

Declinazione di responsabilità
Le informazioni e le pubblicazioni non sono intese come, e non costituiscono, consulenza o raccomandazioni finanziarie, di investimento, di trading o di altro tipo fornite o approvate da TradingView. Per ulteriori informazioni, consultare i Termini di utilizzo.
Declinazione di responsabilità
Le informazioni e le pubblicazioni non sono intese come, e non costituiscono, consulenza o raccomandazioni finanziarie, di investimento, di trading o di altro tipo fornite o approvate da TradingView. Per ulteriori informazioni, consultare i Termini di utilizzo.