
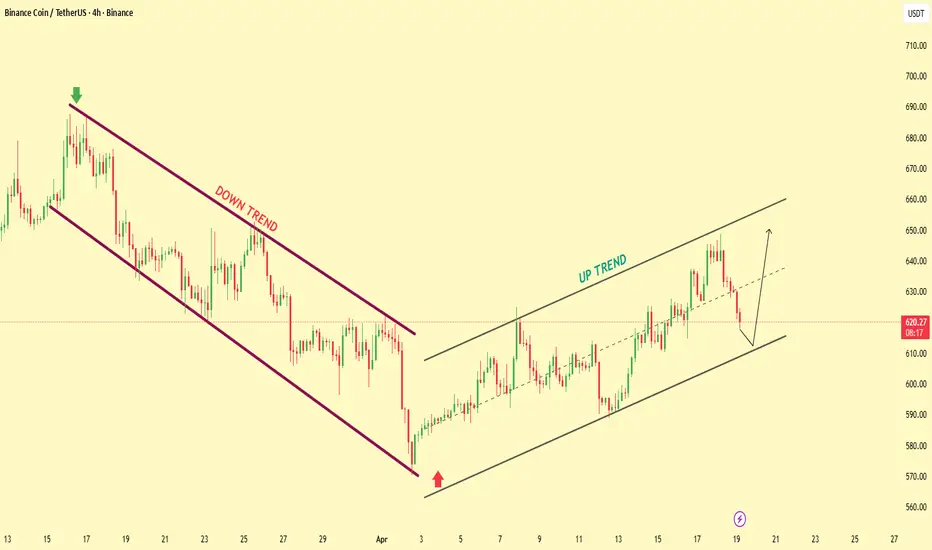
📊 BNB/USDT Market Structure Shift 🔄 | Bearish Channel ➝ Bullish Recovery 🚀
This chart clearly shows a transition phase from a strong downtrend to a developing uptrend channel, highlighting a potential continuation setup.
🔻 Phase 1: Bearish Channel (Distribution Zone)
Price respected a well-defined descending channel with multiple touches.
Consistent lower highs & lower lows confirm strong seller control.
The breakdown near the end shows capitulation / sell-off momentum.
🔄 Phase 2: Reversal & Accumulation
Sharp rejection from the bottom (around 570 zone) indicates strong demand entry.
Formation of a base suggests accumulation before trend shift.
Market structure begins to break previous lower highs.
🔺 Phase 3: Bullish Channel Formation (Uptrend)
Price enters a clean ascending channel with higher highs & higher lows.
Trendline support is respected → confirms buyer dominance.
Internal dotted trendline shows short-term momentum structure.
⚠️ Current Situation (Key Zone)
Price is pulling back from upper resistance of the channel (~640–650).
Currently approaching mid/lower channel support (~610–615).
🎯 Trading Outlook
✅ Bullish Scenario:
If price holds support → continuation toward 650+ zone likely.
❌ Bearish Scenario:
Break below channel support → possible drop toward 600–590.
💡 Conclusion
The market has shifted from bearish control to bullish structure, but current pullback is critical. Watch support reaction carefully — this is a decision zone.
This chart clearly shows a transition phase from a strong downtrend to a developing uptrend channel, highlighting a potential continuation setup.
🔻 Phase 1: Bearish Channel (Distribution Zone)
Price respected a well-defined descending channel with multiple touches.
Consistent lower highs & lower lows confirm strong seller control.
The breakdown near the end shows capitulation / sell-off momentum.
🔄 Phase 2: Reversal & Accumulation
Sharp rejection from the bottom (around 570 zone) indicates strong demand entry.
Formation of a base suggests accumulation before trend shift.
Market structure begins to break previous lower highs.
🔺 Phase 3: Bullish Channel Formation (Uptrend)
Price enters a clean ascending channel with higher highs & higher lows.
Trendline support is respected → confirms buyer dominance.
Internal dotted trendline shows short-term momentum structure.
⚠️ Current Situation (Key Zone)
Price is pulling back from upper resistance of the channel (~640–650).
Currently approaching mid/lower channel support (~610–615).
🎯 Trading Outlook
✅ Bullish Scenario:
If price holds support → continuation toward 650+ zone likely.
❌ Bearish Scenario:
Break below channel support → possible drop toward 600–590.
💡 Conclusion
The market has shifted from bearish control to bullish structure, but current pullback is critical. Watch support reaction carefully — this is a decision zone.
Trade attivo
**🚀 Trade Result – Target Achieved**
Price reversed cleanly from the downtrend, respected the new bullish channel, and delivered the move exactly as planned.
✅ Structure shift confirmed
✅ Trend followed
🎯 Target hit
Clean setup, clean execution.

✦ MARKET STRATEGY SIGNALS ✦ 📊
Smart Money • Price Action • Precision • good entries
📲 Join Telegram: t.me/marketstrategyentry
Smart Money • Price Action • Precision • good entries
📲 Join Telegram: t.me/marketstrategyentry
Pubblicazioni correlate
Declinazione di responsabilità
Le informazioni e le pubblicazioni non sono intese come, e non costituiscono, consulenza o raccomandazioni finanziarie, di investimento, di trading o di altro tipo fornite o approvate da TradingView. Per ulteriori informazioni, consultare i Termini di utilizzo.
✦ MARKET STRATEGY SIGNALS ✦ 📊
Smart Money • Price Action • Precision • good entries
📲 Join Telegram: t.me/marketstrategyentry
Smart Money • Price Action • Precision • good entries
📲 Join Telegram: t.me/marketstrategyentry
Pubblicazioni correlate
Declinazione di responsabilità
Le informazioni e le pubblicazioni non sono intese come, e non costituiscono, consulenza o raccomandazioni finanziarie, di investimento, di trading o di altro tipo fornite o approvate da TradingView. Per ulteriori informazioni, consultare i Termini di utilizzo.