Long
BQXBTC 2H Descending Triangle
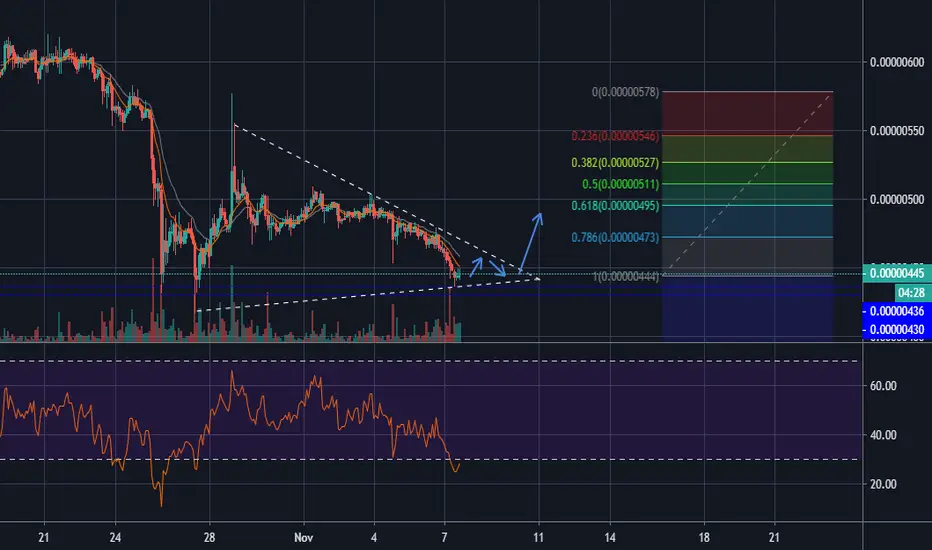
I spotted that BQX has hit an absolute low right now (close to it's ATL), after a downtrend.
My hypothesis is that sooner or later it will bounce from this low (cuz it's a support line) and will break the pattern eventually.
If not we will see a lower ATL for BQX..
I have drawn the pattern, the lines indicated in blue are the support lines. I've used fibonacci retracement for my targets. If my hypothesis is good, we can expect up to a 30% gain.
What do you think about this idea?
My hypothesis is that sooner or later it will bounce from this low (cuz it's a support line) and will break the pattern eventually.
If not we will see a lower ATL for BQX..
I have drawn the pattern, the lines indicated in blue are the support lines. I've used fibonacci retracement for my targets. If my hypothesis is good, we can expect up to a 30% gain.
What do you think about this idea?

Declinazione di responsabilità
Le informazioni e le pubblicazioni non sono intese come, e non costituiscono, consulenza o raccomandazioni finanziarie, di investimento, di trading o di altro tipo fornite o approvate da TradingView. Per ulteriori informazioni, consultare i Termini di utilizzo.
Declinazione di responsabilità
Le informazioni e le pubblicazioni non sono intese come, e non costituiscono, consulenza o raccomandazioni finanziarie, di investimento, di trading o di altro tipo fornite o approvate da TradingView. Per ulteriori informazioni, consultare i Termini di utilizzo.