
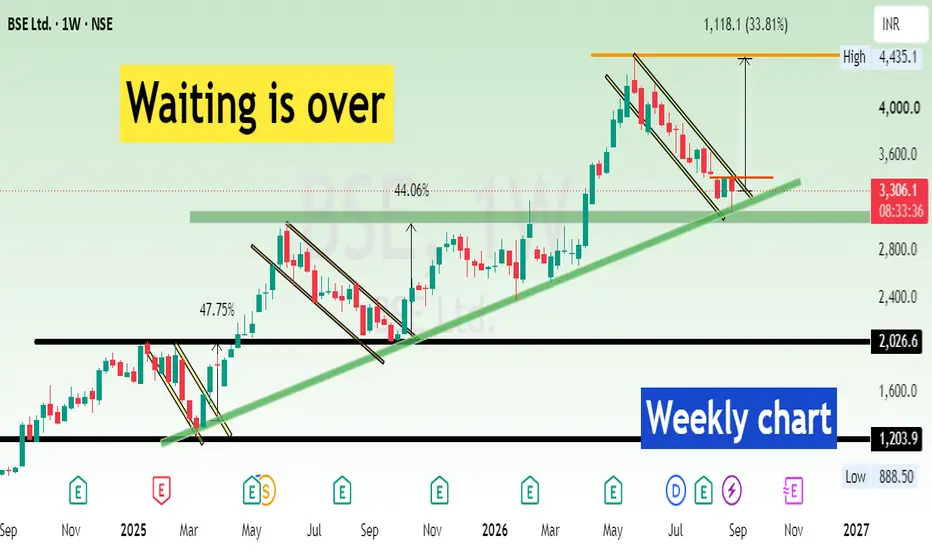
BSE Ltd is currently approaching a crucial long-term support and trendline zone on the weekly chart.
Interestingly, the chart shows a repeating price pattern during previous phases:
Correction → Falling Channel → Trendline Support → Breakout → Strong Upside Move
In the earlier setup, price found support near the long-term rising trendline and then broke out of the falling channel, followed by an approximately 47.75% upside move.
The next similar setup also showed a correction towards the trendline, followed by a breakout and around 44.06% upside move.
Now, BSE is again approaching the long-term rising trendline after a correction from its recent high. The current falling-channel structure is therefore an important area to watch.
Key Levels
Current Zone:3300 area
Major Support:3000–3100
Breakout Confirmation:Above 3420–3450
Potential Upside Zone: 4435
Chart-indicated Upside:Approximately 33.8%++
If the rising trendline continues to hold and BSE breaks out of the current falling structure, the historical pattern could potentially repeat.
However, a weekly breakdown below the 3000–3100 support zone would weaken this setupand invalidate the bullish structure.
Overall View: An interesting risk-reward setup near long-term support, but confirmation is important before expecting the next major move.
Disclaimer: This is a technical analysis based on the chart structure for educational and informational purposes only. The projected levels and historical patterns do not guarantee future returns and should not be considered investment advice.
Interestingly, the chart shows a repeating price pattern during previous phases:
Correction → Falling Channel → Trendline Support → Breakout → Strong Upside Move
In the earlier setup, price found support near the long-term rising trendline and then broke out of the falling channel, followed by an approximately 47.75% upside move.
The next similar setup also showed a correction towards the trendline, followed by a breakout and around 44.06% upside move.
Now, BSE is again approaching the long-term rising trendline after a correction from its recent high. The current falling-channel structure is therefore an important area to watch.
Key Levels
Current Zone:3300 area
Major Support:3000–3100
Breakout Confirmation:Above 3420–3450
Potential Upside Zone: 4435
Chart-indicated Upside:Approximately 33.8%++
If the rising trendline continues to hold and BSE breaks out of the current falling structure, the historical pattern could potentially repeat.
However, a weekly breakdown below the 3000–3100 support zone would weaken this setupand invalidate the bullish structure.
Overall View: An interesting risk-reward setup near long-term support, but confirmation is important before expecting the next major move.
Disclaimer: This is a technical analysis based on the chart structure for educational and informational purposes only. The projected levels and historical patterns do not guarantee future returns and should not be considered investment advice.
Trade attivo
15% Up after this idea post and more to go
Pubblicazioni correlate
Declinazione di responsabilità
Le informazioni e le pubblicazioni non sono intese come, e non costituiscono, consulenza o raccomandazioni finanziarie, di investimento, di trading o di altro tipo fornite o approvate da TradingView. Per ulteriori informazioni, consultare i Termini di utilizzo.
Pubblicazioni correlate
Declinazione di responsabilità
Le informazioni e le pubblicazioni non sono intese come, e non costituiscono, consulenza o raccomandazioni finanziarie, di investimento, di trading o di altro tipo fornite o approvate da TradingView. Per ulteriori informazioni, consultare i Termini di utilizzo.