BTC Dominance – Are We Near the Altseason?
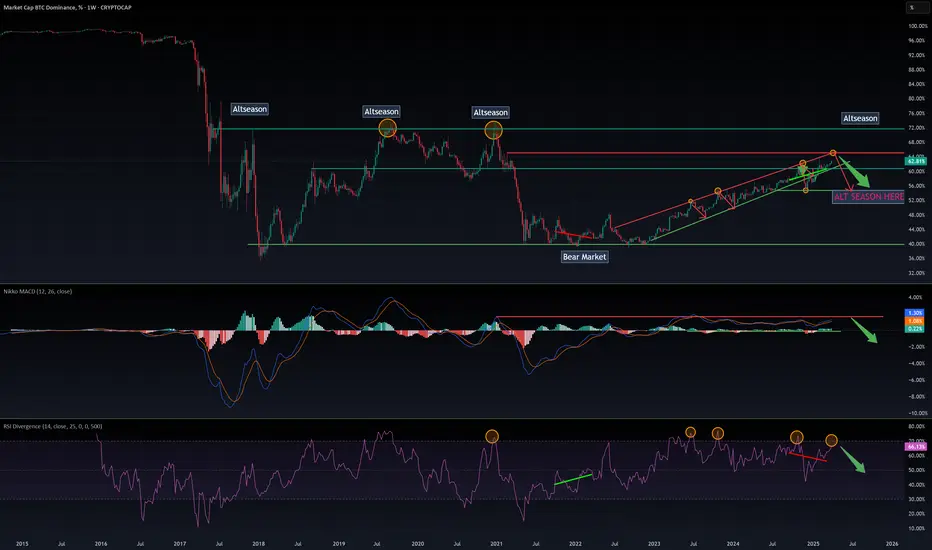
BTC dominance has been rising recently, and many believe the real altseason will begin once BTC.D reaches 71%, just like in the previous cycle.
However, it might happen sooner than expected.
On the 1W timeframe, several signs are flashing:
🔗
On the Daily chart:
🔗
On the Monthly chart, it’s pretty clear we’re nearing the end of the BTC dominance cycle, and a rotation of capital is likely to follow soon.
Now, there are 2 possible scenarios:
When you look at the Monthly chart, it’s easy to see that this cycle is different. With an overbought RSI, and a potential break of structure, a long-awaited MACD correction could be the trigger for the real altseason.
🚨 DYOR (Do Your Own Research) 🚨
BTC dominance has been rising recently, and many believe the real altseason will begin once BTC.D reaches 71%, just like in the previous cycle.
However, it might happen sooner than expected.
On the 1W timeframe, several signs are flashing:
- RSI is showing a bearish divergence that’s about to play out.
- Since January 2023, the MACD has been in overbought territory.
- Each time RSI peaked above 70%, we saw a rejection of 8–10%. It's currently at 68% and nearing that level again.
- On December 2nd, 2024, the structure was broken, but it has since re-entered its rising channel.
🔗
On the Daily chart:
- BTC.D is approaching its cycle peak around 65%, which should act as a resistance and potential reversal point.
- Since the structure was already broken once, another downside break is highly probable.
🔗
On the Monthly chart, it’s pretty clear we’re nearing the end of the BTC dominance cycle, and a rotation of capital is likely to follow soon.
Now, there are 2 possible scenarios:
- Altseason starts at 65% in this cycle.
- Altseason starts again at 71%, mirroring the previous cycle.
When you look at the Monthly chart, it’s easy to see that this cycle is different. With an overbought RSI, and a potential break of structure, a long-awaited MACD correction could be the trigger for the real altseason.
🚨 DYOR (Do Your Own Research) 🚨
Trade attivo
63.3%, BTC.D is moving toward our goal at 65% at fast speed.Updated chart
Trade chiuso manualmente
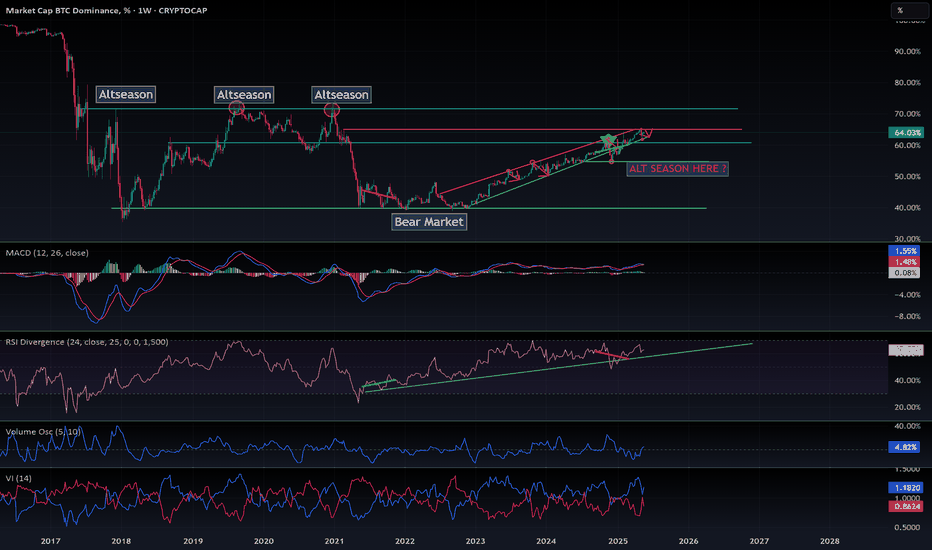
As shown in the updated chart, the push toward 65% for BTC.D has been tempered by rising resistance, marked in red.Currently, BTC.D appears to be experiencing a MACD crossover, signaling a potential correction. If this plays out, it could trigger a pump in
 TOTAL and $OTHERS.
Some altcoins are already showing signs of strength —
 PEPE and
  RENDER are among the early movers.
Will we top out at the forecasted 65%, or will
 BTC begin to show signs of weakness?
Next week holds the answer. If
BTC breaks up from the  83K–$86K range and bounces back up to $91K, we might just reach that target.
Nota
BTC.D is at 65%, mission accomplished.Nota
And now BTC.D is doing exactly what was forecasted 2 months ago, pull back and altseason starting.Nota
New fresh idea publsihed about BTC.DNota

Declinazione di responsabilità
Le informazioni e le pubblicazioni non sono intese come, e non costituiscono, consulenza o raccomandazioni finanziarie, di investimento, di trading o di altro tipo fornite o approvate da TradingView. Per ulteriori informazioni, consultare i Termini di utilizzo.
Declinazione di responsabilità
Le informazioni e le pubblicazioni non sono intese come, e non costituiscono, consulenza o raccomandazioni finanziarie, di investimento, di trading o di altro tipo fornite o approvate da TradingView. Per ulteriori informazioni, consultare i Termini di utilizzo.