
Hello
It's a Bitcoin Guide.
My analysis is optimized for TradingView.
If you press the Replay button, you can check real-time movements.

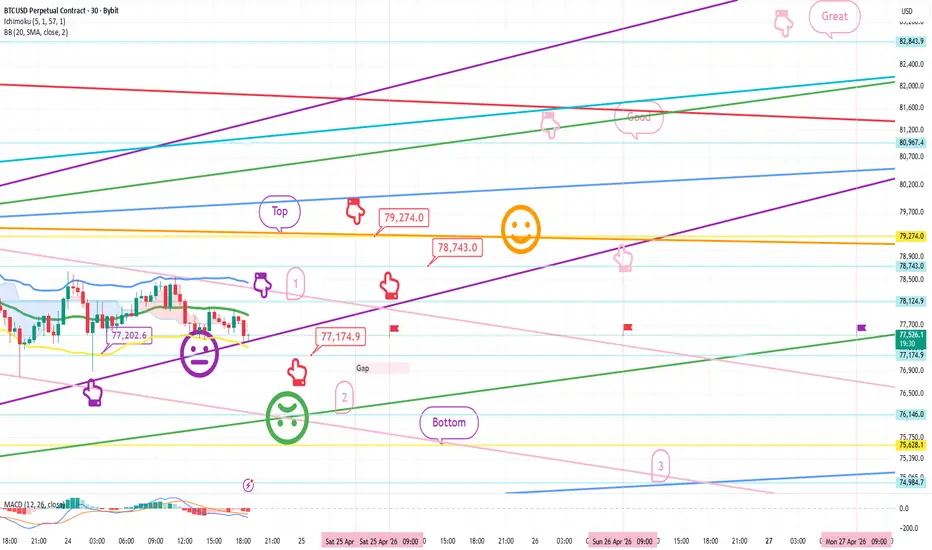
This is the Bitcoin 30-minute chart.
On the left, marked with the purple finger, I have connected the strategy exactly to the entry point of the long position I entered yesterday, 77.2K.
*The long position strategy is based on the time before and after touching section #1 marked with the purple finger at the top.
-Please pay close attention as there are many sections to explain today.
1) After confirming the touch of the purple finger at Zone 1 at the top,
At the bottom, the red finger indicates the entry zone for the $77,174.9 long position / Stop-loss price if the green support line is broken.
2) $79,274 long position 1st target -> Target prices in the order of Good, Great.
(If the rise is successful, refer to the expected path indicated by the pink finger in the middle.)
*If the price drops immediately without touching the purple finger at Zone 1:
At the bottom, Zone 2 indicates the entry zone for the $76.1K long position / Stop-loss price if the green support line is broken.
The stop-loss price is the same for those maintaining the $77.2K long position entered yesterday.
If the green support line at Zone 2 is broken,
the price may drop from the Bottom to Zone 3 over the weekend, so please exercise caution.
- Currently, a MACD dead cross is in progress on the 12-hour chart.
If the purple support line is maintained without breaking,
the warning signal will be ignored, and a vertical surge may occur.
Please use my analysis merely for reference and practical application.
I hope you operate safely by adhering to trading principles and strictly using stop-loss orders.
Thank you.
It's a Bitcoin Guide.
My analysis is optimized for TradingView.
If you press the Replay button, you can check real-time movements.
This is the Bitcoin 30-minute chart.
On the left, marked with the purple finger, I have connected the strategy exactly to the entry point of the long position I entered yesterday, 77.2K.
*The long position strategy is based on the time before and after touching section #1 marked with the purple finger at the top.
-Please pay close attention as there are many sections to explain today.
1) After confirming the touch of the purple finger at Zone 1 at the top,
At the bottom, the red finger indicates the entry zone for the $77,174.9 long position / Stop-loss price if the green support line is broken.
2) $79,274 long position 1st target -> Target prices in the order of Good, Great.
(If the rise is successful, refer to the expected path indicated by the pink finger in the middle.)
*If the price drops immediately without touching the purple finger at Zone 1:
At the bottom, Zone 2 indicates the entry zone for the $76.1K long position / Stop-loss price if the green support line is broken.
The stop-loss price is the same for those maintaining the $77.2K long position entered yesterday.
If the green support line at Zone 2 is broken,
the price may drop from the Bottom to Zone 3 over the weekend, so please exercise caution.
- Currently, a MACD dead cross is in progress on the 12-hour chart.
If the purple support line is maintained without breaking,
the warning signal will be ignored, and a vertical surge may occur.
Please use my analysis merely for reference and practical application.
I hope you operate safely by adhering to trading principles and strictly using stop-loss orders.
Thank you.
Trade chiuso: obiettivo raggiunto
Hello.This is the Bitcoin Guide.
Let's check the movements since the analysis post was written on April 24th.
This is the Bitcoin 30-minute chart.
I have marked the key zones with a black finger.
In the bottom left, I connected the strategy exactly at the entry point for the long position entered on the 23rd
(marked by the purple finger), $77,202.6.
*In the long position strategy (marked by the red finger),
after switching from a short position at the top (purple finger zone #1) to a long position at $77,174.9,
it touched the top zone of $79,274 without breaking the green support line.
The strategy was executed as a perfect take-profit.
After the new weekly and daily candles formed this week,
the New Gap zone that occurred last week was filled in one fell swoop.
It is currently consolidating after a strong correction,
but I will keep going strong today as well.
Thank you.

[Bitcoin Guide Affiliate]
*Bybit 20%DC Lifetime + $30,100
partner.bybit.com/b/Bitcoin_Guide
*BingX 50%DC + $14,100
bit.ly/3E8ZkAW
*ZeroMarket ECN 40%DC
bit.ly/3pY0dUv
*Telegram
t.me/bitcoinguide_TM
*Bybit 20%DC Lifetime + $30,100
partner.bybit.com/b/Bitcoin_Guide
*BingX 50%DC + $14,100
bit.ly/3E8ZkAW
*ZeroMarket ECN 40%DC
bit.ly/3pY0dUv
*Telegram
t.me/bitcoinguide_TM
Pubblicazioni correlate
Declinazione di responsabilità
Le informazioni e le pubblicazioni non sono intese come, e non costituiscono, consulenza o raccomandazioni finanziarie, di investimento, di trading o di altro tipo fornite o approvate da TradingView. Per ulteriori informazioni, consultare i Termini di utilizzo.
[Bitcoin Guide Affiliate]
*Bybit 20%DC Lifetime + $30,100
partner.bybit.com/b/Bitcoin_Guide
*BingX 50%DC + $14,100
bit.ly/3E8ZkAW
*ZeroMarket ECN 40%DC
bit.ly/3pY0dUv
*Telegram
t.me/bitcoinguide_TM
*Bybit 20%DC Lifetime + $30,100
partner.bybit.com/b/Bitcoin_Guide
*BingX 50%DC + $14,100
bit.ly/3E8ZkAW
*ZeroMarket ECN 40%DC
bit.ly/3pY0dUv
*Telegram
t.me/bitcoinguide_TM
Pubblicazioni correlate
Declinazione di responsabilità
Le informazioni e le pubblicazioni non sono intese come, e non costituiscono, consulenza o raccomandazioni finanziarie, di investimento, di trading o di altro tipo fornite o approvate da TradingView. Per ulteriori informazioni, consultare i Termini di utilizzo.