
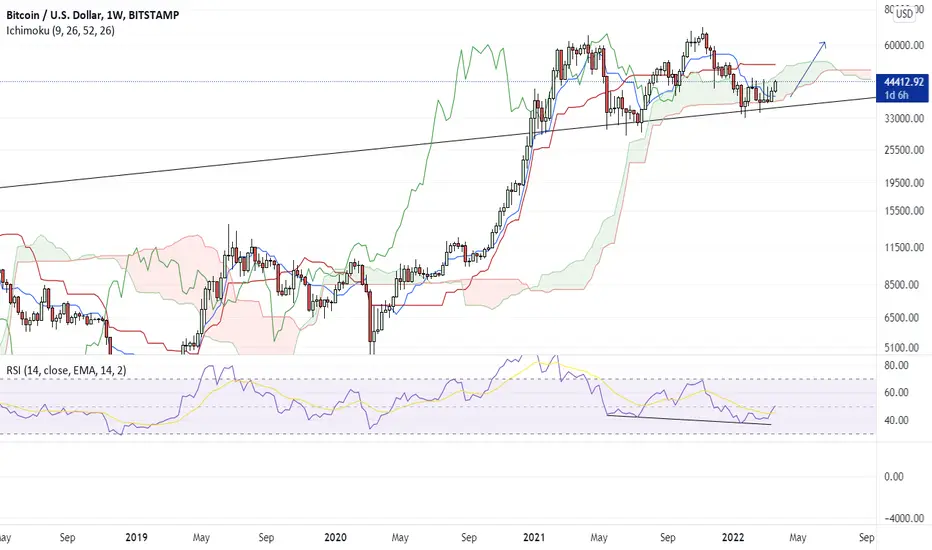
The Bitcoin chart shows the RSI divergence in the weekly time frame. Which can be a sign of its bulish. In addition, the bitcoin chart is in support of the Tankensen and if it break the Ichimokue cloud and is supported by the Kijensen, it will probably climb higher.

Declinazione di responsabilità
Le informazioni e le pubblicazioni non sono intese come, e non costituiscono, consulenza o raccomandazioni finanziarie, di investimento, di trading o di altro tipo fornite o approvate da TradingView. Per ulteriori informazioni, consultare i Termini di utilizzo.
Declinazione di responsabilità
Le informazioni e le pubblicazioni non sono intese come, e non costituiscono, consulenza o raccomandazioni finanziarie, di investimento, di trading o di altro tipo fornite o approvate da TradingView. Per ulteriori informazioni, consultare i Termini di utilizzo.