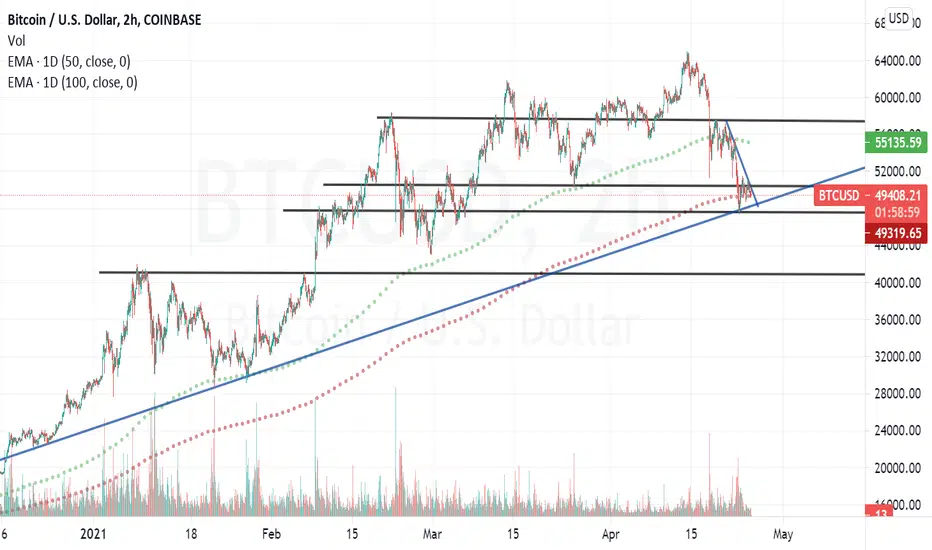
 BTCUSD. I thought that I would spend a few minutes separating the noise from the media and set aside some of the claims made on this platform, among many others, associated with the recent decline of the bitcoin price.
 - Late 2020/2021 Trend Line has not been breached (blue line)
- However, BTC broke through its 50DEMA
- But strong support remains at the 100DEMA
- Horizontal lines are either strong support or resistance lines
Please let me know of any questions.
Best,
-Bill Herrmann
See also;
Links to Related Ideas (below)
Obligatory Legal Disclaimer:
THE INFORMATION CONTAINED HEREIN REPRESENTS THE AUTHOR’S SUBJECTIVE BELIEF AND MAY OR NOT BE THE VIEWS OF WILSHIRE PHOENIX FUNDS LLC ("WILSHIRE PHOENIX"). THE INFORMATION AND OPINIONS PROVIDED HEREIN SHOULD NOT BE TAKEN AS SPECIFIC ADVICE ON THE MERITS OF ANY INVESTMENT DECISION. NEITHER THE AUTHOR, WILSHIRE PHOENIX, NOR ANY OF ITS AFFILIATES ACCEPT ANY LIABILITY WHATSOEVER FOR ANY DIRECT OR CONSEQUENTIAL LOSS HOWSOEVER ARISING, DIRECTLY OR INDIRECTLY, FROM ANY USE OF THE INFORMATION CONTAINED HEREIN.

Pubblicazioni correlate
Declinazione di responsabilità
Le informazioni e le pubblicazioni non sono intese come, e non costituiscono, consulenza o raccomandazioni finanziarie, di investimento, di trading o di altro tipo fornite o approvate da TradingView. Per ulteriori informazioni, consultare i Termini di utilizzo.
Pubblicazioni correlate
Declinazione di responsabilità
Le informazioni e le pubblicazioni non sono intese come, e non costituiscono, consulenza o raccomandazioni finanziarie, di investimento, di trading o di altro tipo fornite o approvate da TradingView. Per ulteriori informazioni, consultare i Termini di utilizzo.