
Market Structure
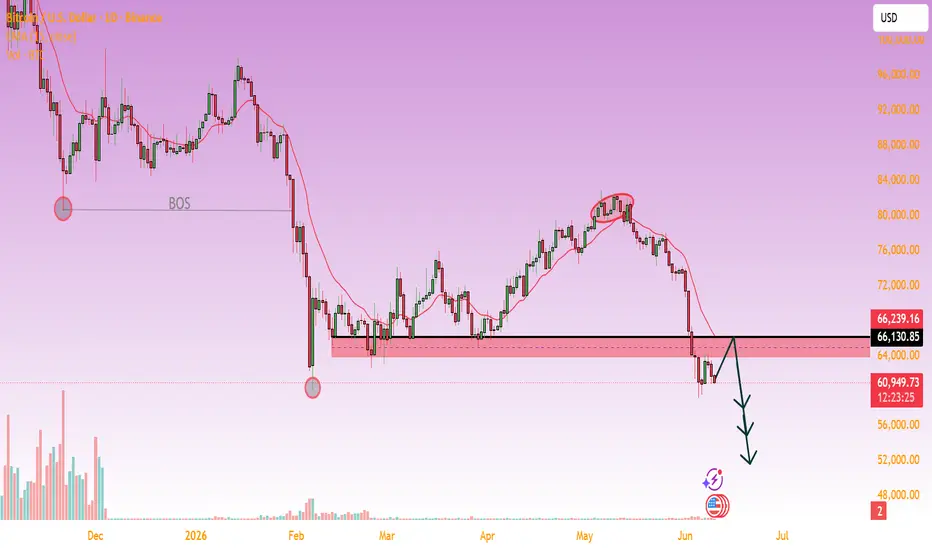
This BTCUSD 1D chart shows a clear bearish market structure shift:
The previous support around $80,000 was broken earlier (marked as BOS – Break of Structure).
After the breakdown, price formed a lower high and failed to reclaim previous resistance.
The recent selloff pushed BTC below the important $64,000–$66,000 support zone (highlighted in pink).
Key Technical Observations
✅ Support Turned Resistance
The black horizontal level around $66,130 acted as support multiple times.
Price has now broken below it, making it a potential resistance area.
✅ Bearish Retest Setup
The drawn projection suggests a pullback toward the broken zone.
If sellers defend the $64K–$66K area, the retest could trigger another leg down.
✅ Moving Average Pressure
Price is trading below the red moving average.
The moving average is sloping downward, confirming bearish momentum.
Bearish Scenario (Higher Probability Based on Current Structure)
Price retests $64K–$66K.
Rejection from resistance.
Continuation toward lower liquidity zones.
Potential downside targets:
$58,000
$55,000
$52,000
$50,000 psychological level
Invalidation
The bearish outlook weakens if:
BTC closes back above $66,130.
Buyers reclaim the resistance zone and hold it as support.
A higher high forms above the recent swing high near $81,000.
Trading Bias
Current Bias: Bearish 📉
As long as BTC remains below the $64K–$66K supply/resistance zone, sellers appear to control the market and further downside remains likely.
This BTCUSD 1D chart shows a clear bearish market structure shift:
The previous support around $80,000 was broken earlier (marked as BOS – Break of Structure).
After the breakdown, price formed a lower high and failed to reclaim previous resistance.
The recent selloff pushed BTC below the important $64,000–$66,000 support zone (highlighted in pink).
Key Technical Observations
✅ Support Turned Resistance
The black horizontal level around $66,130 acted as support multiple times.
Price has now broken below it, making it a potential resistance area.
✅ Bearish Retest Setup
The drawn projection suggests a pullback toward the broken zone.
If sellers defend the $64K–$66K area, the retest could trigger another leg down.
✅ Moving Average Pressure
Price is trading below the red moving average.
The moving average is sloping downward, confirming bearish momentum.
Bearish Scenario (Higher Probability Based on Current Structure)
Price retests $64K–$66K.
Rejection from resistance.
Continuation toward lower liquidity zones.
Potential downside targets:
$58,000
$55,000
$52,000
$50,000 psychological level
Invalidation
The bearish outlook weakens if:
BTC closes back above $66,130.
Buyers reclaim the resistance zone and hold it as support.
A higher high forms above the recent swing high near $81,000.
Trading Bias
Current Bias: Bearish 📉
As long as BTC remains below the $64K–$66K supply/resistance zone, sellers appear to control the market and further downside remains likely.

Join My telegram channel Free:
t.me/+r-thYiraqh4xNjI0
t.me/+r-thYiraqh4xNjI0
Declinazione di responsabilità
Le informazioni e le pubblicazioni non sono intese come, e non costituiscono, consulenza o raccomandazioni finanziarie, di investimento, di trading o di altro tipo fornite o approvate da TradingView. Per ulteriori informazioni, consultare i Termini di utilizzo.
Join My telegram channel Free:
t.me/+r-thYiraqh4xNjI0
t.me/+r-thYiraqh4xNjI0
Declinazione di responsabilità
Le informazioni e le pubblicazioni non sono intese come, e non costituiscono, consulenza o raccomandazioni finanziarie, di investimento, di trading o di altro tipo fornite o approvate da TradingView. Per ulteriori informazioni, consultare i Termini di utilizzo.