
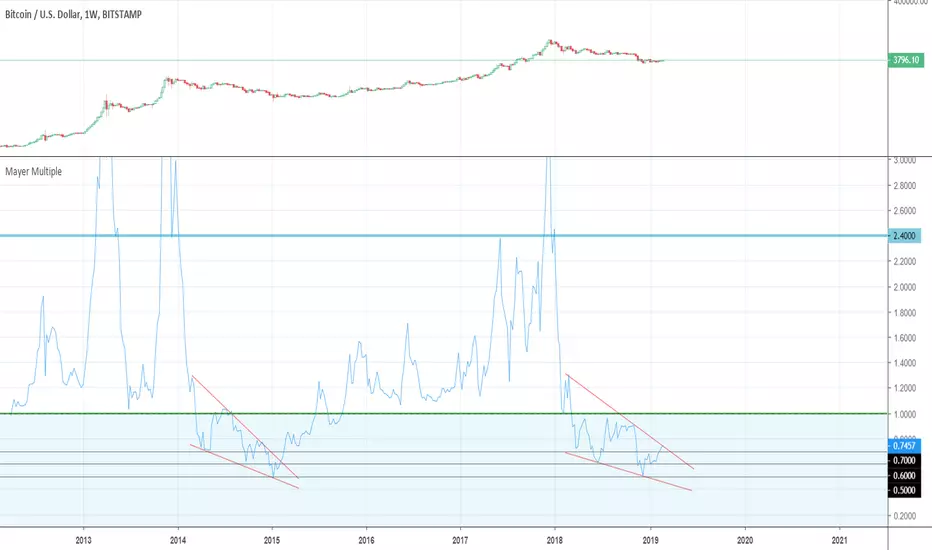
Hello! I am not a professional trader. I just like to look at the charts and try to find similarities over time. Recently I noticed a similar pattern for The Mayer Multiple (the multiple of the current Bitcoin price over the 200-days moving average). The time period and the bouncing levels (0.70, 0.60 and 0.50) look very similar for the years 2014-15 and 2018-19.

Declinazione di responsabilità
Le informazioni e le pubblicazioni non sono intese come, e non costituiscono, consulenza o raccomandazioni finanziarie, di investimento, di trading o di altro tipo fornite o approvate da TradingView. Per ulteriori informazioni, consultare i Termini di utilizzo.
Declinazione di responsabilità
Le informazioni e le pubblicazioni non sono intese come, e non costituiscono, consulenza o raccomandazioni finanziarie, di investimento, di trading o di altro tipo fornite o approvate da TradingView. Per ulteriori informazioni, consultare i Termini di utilizzo.