
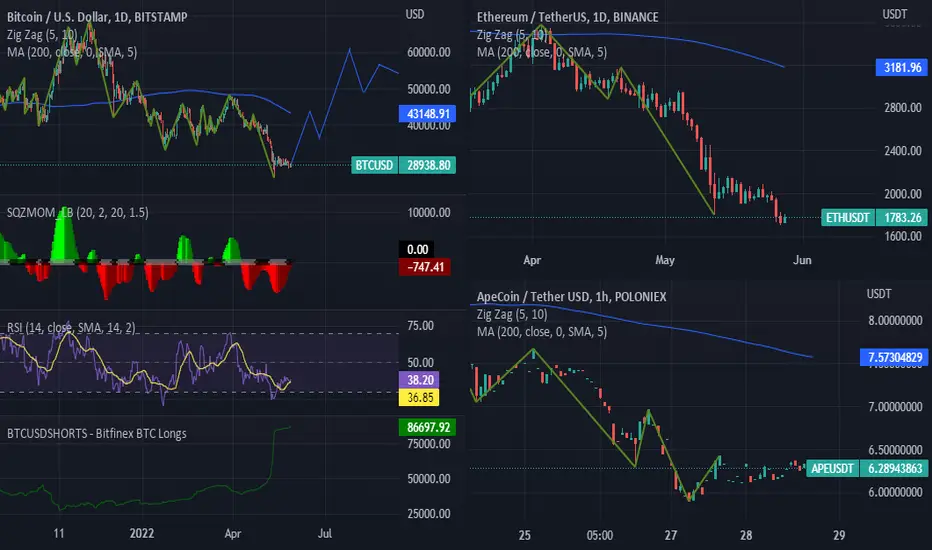
Ethereum and Bitcoin have both hit the lower end of the RSI Indicator. 8 weeks of red and frustration from recent events have created a situation where the new bull market could result in a possible new high. Most interestingly is the Weekly (14) RSI is at a history low indicating the market has exhausted its selling pressure. Targeting 63 RSI on the daily BITCOIN CHART followed by a correction before rocketing the Daily 73-77RSI range.

Declinazione di responsabilità
Le informazioni e le pubblicazioni non sono intese come, e non costituiscono, consulenza o raccomandazioni finanziarie, di investimento, di trading o di altro tipo fornite o approvate da TradingView. Per ulteriori informazioni, consultare i Termini di utilizzo.
Declinazione di responsabilità
Le informazioni e le pubblicazioni non sono intese come, e non costituiscono, consulenza o raccomandazioni finanziarie, di investimento, di trading o di altro tipo fornite o approvate da TradingView. Per ulteriori informazioni, consultare i Termini di utilizzo.