
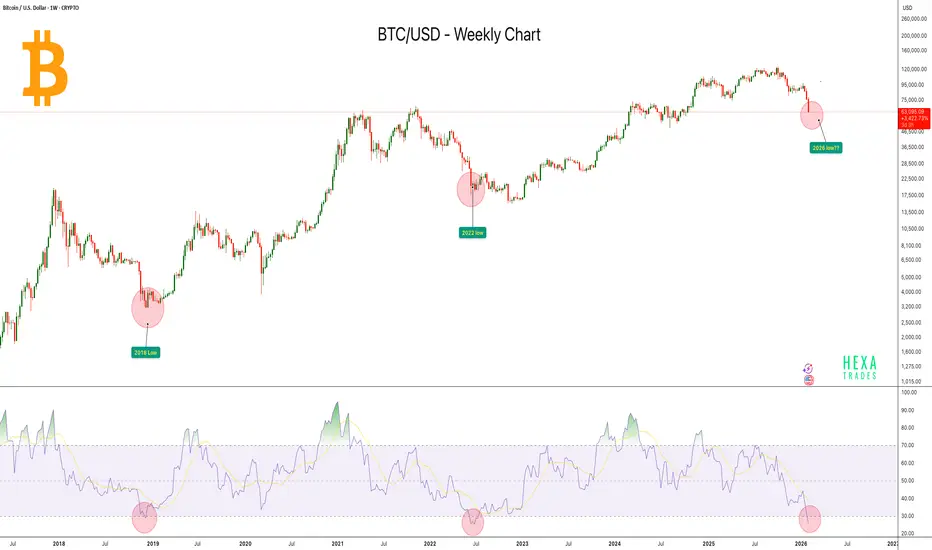
Bitcoin is currently approaching a zone that historically aligns with major cycle lows, highlighted by the marked reactions in 2018 and 2022. Each of these areas formed after extended bearish corrections and ultimately led to the start of a new bullish expansion phase.
One of the most important confluences visible on the chart is the Weekly RSI dropping into oversold territory. Historically, whenever RSI has reached or dropped near the 30 level on the weekly timeframe, Bitcoin has formed macro bottoms shortly after. These oversold conditions typically signal seller exhaustion and long-term accumulation opportunities.
At present, BTC is once again showing a similar structure:
- Price is correcting after a strong bullish cycle
- Weekly RSI is entering oversold levels
- Market structure is beginning to resemble previous cycle bottom formations
If historical behavior repeats, this region could potentially act as a 2026 cycle low zone, where long-term buyers step in and momentum gradually shifts back to the upside. However, confirmation through stabilization, higher lows, and momentum reversal would strengthen the bullish outlook.
Key Observations:
- Previous cycle lows formed when weekly RSI approached oversold levels
- Strong historical pattern connecting RSI extremes with macro reversals
- Current price action mirrors prior bear market bottom structures
Traders and investors should monitor price behavior closely around this region. A strong reclaim of momentum could signal the early stages of a new long-term uptrend, while continued weakness may delay the cycle bottom formation.
Cheers
Hexa
One of the most important confluences visible on the chart is the Weekly RSI dropping into oversold territory. Historically, whenever RSI has reached or dropped near the 30 level on the weekly timeframe, Bitcoin has formed macro bottoms shortly after. These oversold conditions typically signal seller exhaustion and long-term accumulation opportunities.
At present, BTC is once again showing a similar structure:
- Price is correcting after a strong bullish cycle
- Weekly RSI is entering oversold levels
- Market structure is beginning to resemble previous cycle bottom formations
If historical behavior repeats, this region could potentially act as a 2026 cycle low zone, where long-term buyers step in and momentum gradually shifts back to the upside. However, confirmation through stabilization, higher lows, and momentum reversal would strengthen the bullish outlook.
Key Observations:
- Previous cycle lows formed when weekly RSI approached oversold levels
- Strong historical pattern connecting RSI extremes with macro reversals
- Current price action mirrors prior bear market bottom structures
Traders and investors should monitor price behavior closely around this region. A strong reclaim of momentum could signal the early stages of a new long-term uptrend, while continued weakness may delay the cycle bottom formation.
Cheers
Hexa

🚀Telegram : t.me/hexatrades
🌐Website: hexatrades.io/
🗣️Twitter(X): twitter.com/HexaTrades
🌐Website: hexatrades.io/
🗣️Twitter(X): twitter.com/HexaTrades
Declinazione di responsabilità
Le informazioni e le pubblicazioni non sono intese come, e non costituiscono, consulenza o raccomandazioni finanziarie, di investimento, di trading o di altro tipo fornite o approvate da TradingView. Per ulteriori informazioni, consultare i Termini di utilizzo.
🚀Telegram : t.me/hexatrades
🌐Website: hexatrades.io/
🗣️Twitter(X): twitter.com/HexaTrades
🌐Website: hexatrades.io/
🗣️Twitter(X): twitter.com/HexaTrades
Declinazione di responsabilità
Le informazioni e le pubblicazioni non sono intese come, e non costituiscono, consulenza o raccomandazioni finanziarie, di investimento, di trading o di altro tipo fornite o approvate da TradingView. Per ulteriori informazioni, consultare i Termini di utilizzo.