
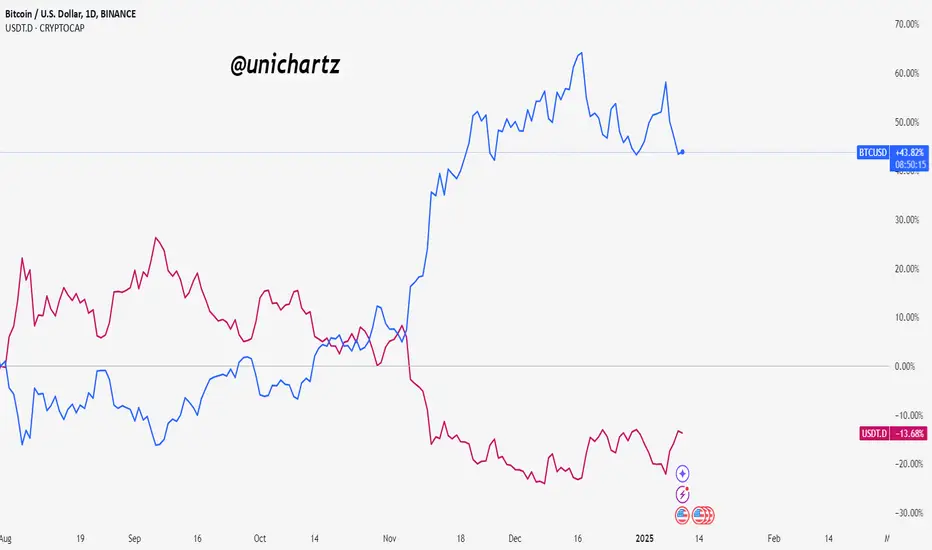
The chart highlights the inverse relationship between BTC/USDT and USDT.D (Tether Dominance). When USDT.D drops, capital flows out of stablecoins into Bitcoin, driving BTC’s price higher.
Conversely, a rise in USDT.D signals increased caution, often leading to BTC price declines. This correlation helps traders gauge market sentiment and identify potential trend shifts.
Conversely, a rise in USDT.D signals increased caution, often leading to BTC price declines. This correlation helps traders gauge market sentiment and identify potential trend shifts.

Daily Free Signals :bit.ly/UnichartzAlpha
Register on Bitunix and trade with me: 👇
bitunix.com/register?vipCode=coEA
Register on Bitunix and trade with me: 👇
bitunix.com/register?vipCode=coEA
Declinazione di responsabilità
Le informazioni e le pubblicazioni non sono intese come, e non costituiscono, consulenza o raccomandazioni finanziarie, di investimento, di trading o di altro tipo fornite o approvate da TradingView. Per ulteriori informazioni, consultare i Termini di utilizzo.
Daily Free Signals :bit.ly/UnichartzAlpha
Register on Bitunix and trade with me: 👇
bitunix.com/register?vipCode=coEA
Register on Bitunix and trade with me: 👇
bitunix.com/register?vipCode=coEA
Declinazione di responsabilità
Le informazioni e le pubblicazioni non sono intese come, e non costituiscono, consulenza o raccomandazioni finanziarie, di investimento, di trading o di altro tipo fornite o approvate da TradingView. Per ulteriori informazioni, consultare i Termini di utilizzo.