
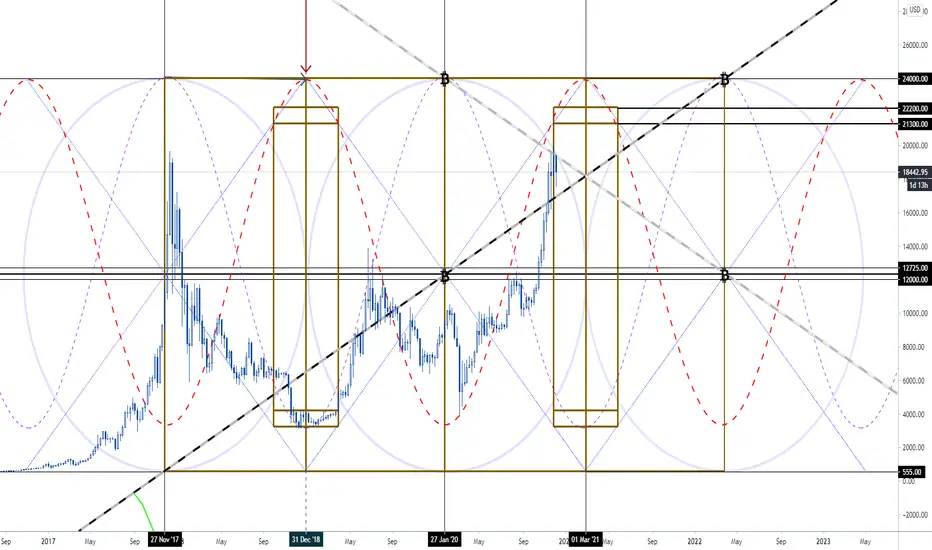
Using a hybrid drawing/indicator method to find center, mean, and tangents. From there, I found some interesting alignments and sine that capture the price repeatedly. Follow the price and use this as a tool to confirm your own interpretation. See how the price respects/crosses over/ breaks down as in interacts with the trends, vertical pivot lines, sine lines and levels. I'm big on balance and natural movement so these charts are great foundations for finding possible future price coordinates. Looks like a chance to climb to another ATH still remains but real volume and orders will be the deciding factor before the next major pivot is due. 

Declinazione di responsabilità
Le informazioni e le pubblicazioni non sono intese come, e non costituiscono, consulenza o raccomandazioni finanziarie, di investimento, di trading o di altro tipo fornite o approvate da TradingView. Per ulteriori informazioni, consultare i Termini di utilizzo.
Declinazione di responsabilità
Le informazioni e le pubblicazioni non sono intese come, e non costituiscono, consulenza o raccomandazioni finanziarie, di investimento, di trading o di altro tipo fornite o approvate da TradingView. Per ulteriori informazioni, consultare i Termini di utilizzo.