
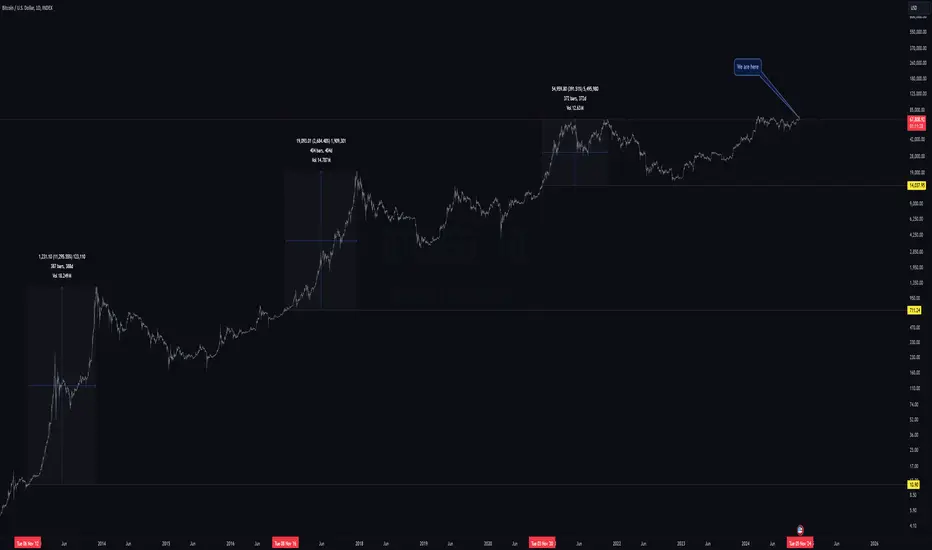
This charts the dates of the previous three US Elections (2012, 2016 and 2020) on a log chart, with price on the horizontal axis at daily candle close.
As you can see, once price breaks above (sometimes next day, as in 2020, sometimes a week or more later, as in 2016 and in 2012) price has never returned - ever.
Plotted are the time and percentage difference from election date to cycle ATH. On average it's 387 days apart.
If things play out this time in a similar fashion we can expect this week into mid next week to be the final time BTC will be in the mid 60k per coin - ever.
As you can see, once price breaks above (sometimes next day, as in 2020, sometimes a week or more later, as in 2016 and in 2012) price has never returned - ever.
Plotted are the time and percentage difference from election date to cycle ATH. On average it's 387 days apart.
If things play out this time in a similar fashion we can expect this week into mid next week to be the final time BTC will be in the mid 60k per coin - ever.

Declinazione di responsabilità
Le informazioni e le pubblicazioni non sono intese come, e non costituiscono, consulenza o raccomandazioni finanziarie, di investimento, di trading o di altro tipo fornite o approvate da TradingView. Per ulteriori informazioni, consultare i Termini di utilizzo.
Declinazione di responsabilità
Le informazioni e le pubblicazioni non sono intese come, e non costituiscono, consulenza o raccomandazioni finanziarie, di investimento, di trading o di altro tipo fornite o approvate da TradingView. Per ulteriori informazioni, consultare i Termini di utilizzo.