Bitcoin: Monthly Range Support Holds as Bulls Target Higher Distribution
Bitcoin’s current structure suggests a potential continuation move after successfully defending a key monthly range low.
 BTCUSD MONTHLY

From March 1 to October 1, 2024, Bitcoin traded inside a broad consolidation range between $58,500 and $74,600. The market spent several months building liquidity before breaking above the range on November 1, 2024, eventually pushing toward new all-time highs.
Following that expansion, price has retraced back into the same monthly range and is currently testing the lower boundary of that structure. The important observation is that the previous resistance zone around the range low is now acting as potential support, creating a possible accumulation area.
BTCUSD WEEKLY

On the weekly timeframe, Bitcoin experienced a controlled retracement of two weekly candles, moving from approximately $65,900 down toward $63,300. Instead of continuing lower, price reclaimed momentum and broke higher, suggesting buyers are defending the lower levels.
The weekly structure also shows price reacting from a previous weekly supply proximal zone, which is now behaving as demand. This type of market behaviour often indicates a transition where previous selling pressure becomes a foundation for the next expansion phase.
BTCUSD 4 HOUR

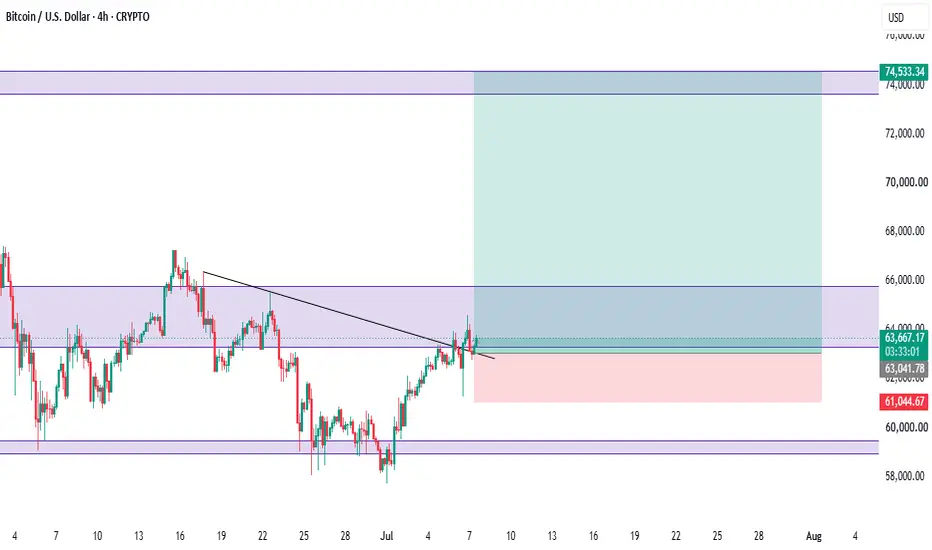
On the 4-hour timeframe, Bitcoin has broken above a bearish trendline while forming multiple bullish candles. This breakout shows improving short-term momentum and supports the idea that buyers are attempting to regain control.
The current setup:
Monthly range: $58,500 – $74,600
Key support: Monthly range low
Weekly confirmation: Demand reaction and breakout after retracement
Lower timeframe confirmation: 4H bearish trendline breakout
The potential trade idea is a long position from the current support structure, targeting a move back toward the monthly range high.
Risk management example:
Risk-to-reward: 1:6
The thesis remains invalid if Bitcoin loses the established support structure and returns below the range low with acceptance.
This is not a prediction of guaranteed upside, but a study of how higher timeframe accumulation, weekly demand reaction, and lower timeframe momentum are aligning within the current market structure.
put together by : Pako Phutietsile as currencynerd
Bitcoin’s current structure suggests a potential continuation move after successfully defending a key monthly range low.
BTCUSD MONTHLYFrom March 1 to October 1, 2024, Bitcoin traded inside a broad consolidation range between $58,500 and $74,600. The market spent several months building liquidity before breaking above the range on November 1, 2024, eventually pushing toward new all-time highs.
Following that expansion, price has retraced back into the same monthly range and is currently testing the lower boundary of that structure. The important observation is that the previous resistance zone around the range low is now acting as potential support, creating a possible accumulation area.
BTCUSD WEEKLY On the weekly timeframe, Bitcoin experienced a controlled retracement of two weekly candles, moving from approximately $65,900 down toward $63,300. Instead of continuing lower, price reclaimed momentum and broke higher, suggesting buyers are defending the lower levels.
The weekly structure also shows price reacting from a previous weekly supply proximal zone, which is now behaving as demand. This type of market behaviour often indicates a transition where previous selling pressure becomes a foundation for the next expansion phase.
BTCUSD 4 HOUROn the 4-hour timeframe, Bitcoin has broken above a bearish trendline while forming multiple bullish candles. This breakout shows improving short-term momentum and supports the idea that buyers are attempting to regain control.
The current setup:
Monthly range: $58,500 – $74,600
Key support: Monthly range low
Weekly confirmation: Demand reaction and breakout after retracement
Lower timeframe confirmation: 4H bearish trendline breakout
The potential trade idea is a long position from the current support structure, targeting a move back toward the monthly range high.
Risk management example:
Risk-to-reward: 1:6
The thesis remains invalid if Bitcoin loses the established support structure and returns below the range low with acceptance.
This is not a prediction of guaranteed upside, but a study of how higher timeframe accumulation, weekly demand reaction, and lower timeframe momentum are aligning within the current market structure.
put together by : Pako Phutietsile as currencynerd
Trade attivo
CPI brought us back to entryTrade chiuso manualmente

Pubblicazioni correlate
Declinazione di responsabilità
Le informazioni e le pubblicazioni non sono intese come, e non costituiscono, consulenza o raccomandazioni finanziarie, di investimento, di trading o di altro tipo fornite o approvate da TradingView. Per ulteriori informazioni, consultare i Termini di utilizzo.
Pubblicazioni correlate
Declinazione di responsabilità
Le informazioni e le pubblicazioni non sono intese come, e non costituiscono, consulenza o raccomandazioni finanziarie, di investimento, di trading o di altro tipo fornite o approvate da TradingView. Per ulteriori informazioni, consultare i Termini di utilizzo.