
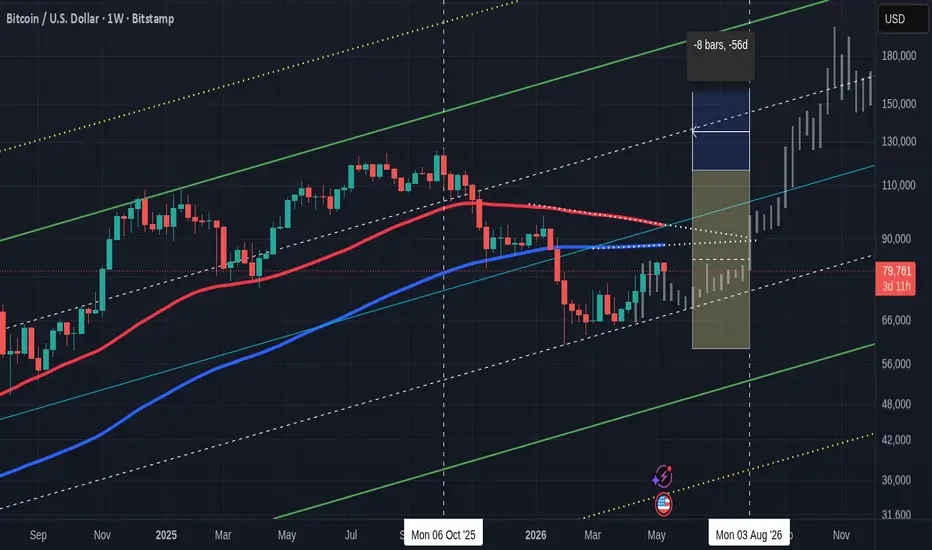
In this chart we will be focusing on the 50 WEEKLY SMA - RED and the 100 WEEKLY SMA - BLUE
In the main Chart above, we cam see that the two SMA are closing in and the Bearish Cross over is projected to be around End of July / early August
And peopel scream and cry BEARISH
But if we look back over Bitcoin History, we can see that the Weekly SMA'a are only telling us what Has alrrady happened, a delayed report.
And infact, when we get a weekly cross over, we are traditionally Near the Turn around, the Bear Bottom.
Let me show you.
From the 2013 ATH

The Rectangle shows us the number of days after that Cross over, to when PA began climbing out of the Bear, 147 days later
But you can also see how the Fall Stopped almost right away...We saw a push higher and rejection off the 50 again but PA did not drop below that price it had when the Cross over occured,
From the 2017 ATH

This one is great because we can see that PA actualy began its push higher BEFORE the SMA Crossover...21 days before...But it could be said it was up to 100 days before.....
But it was 21 days Before Crossover that we saw the start of a sustained push higher.
From the 2021 ATH

We had so many outside influences on Bitcoin in this period that using data here can be mosleading, however, we can see that 73 days after crossover, we saw the beginning of the sustained push.
That Large red candle sown was the result of the FTX Crash and without that, we may have seen PA continue to range sideways, no more drops, as we had seen on previous occasions.
And the Bigger picture.

This is a Bitcoin Channel image.
See how EVERY Low has bounced off that same channel line since 2017. An ever rising LOW
That line is the channel 0,25 line and the line of rejection in the last cycle, where the 2925 ATH was formed, is the channel 1 line. Notice how that was used previously in every cycle.
See how PA leveled out or Rose around that BEARISH SMA crossover.
Lets come back to where we are now.

The projected Crossover is end July / start August.....
Does this mean we have more Drops in PA to come ?
No
Remember in post 2017, we saw PA rise BEFORE the crossover.....anything up to 100 days before....and that is approx where we are now.
But we shoudl remain cautious, Bullish Cautious....I do believe the Bear Bottom was reached a ong time ago and we are n the verge of the Next push....But it maybe tomorrow or in August to October.
We just have to wait.......but it will be worth it.
In the main Chart above, we cam see that the two SMA are closing in and the Bearish Cross over is projected to be around End of July / early August
And peopel scream and cry BEARISH
But if we look back over Bitcoin History, we can see that the Weekly SMA'a are only telling us what Has alrrady happened, a delayed report.
And infact, when we get a weekly cross over, we are traditionally Near the Turn around, the Bear Bottom.
Let me show you.
From the 2013 ATH
The Rectangle shows us the number of days after that Cross over, to when PA began climbing out of the Bear, 147 days later
But you can also see how the Fall Stopped almost right away...We saw a push higher and rejection off the 50 again but PA did not drop below that price it had when the Cross over occured,
From the 2017 ATH
This one is great because we can see that PA actualy began its push higher BEFORE the SMA Crossover...21 days before...But it could be said it was up to 100 days before.....
But it was 21 days Before Crossover that we saw the start of a sustained push higher.
From the 2021 ATH
We had so many outside influences on Bitcoin in this period that using data here can be mosleading, however, we can see that 73 days after crossover, we saw the beginning of the sustained push.
That Large red candle sown was the result of the FTX Crash and without that, we may have seen PA continue to range sideways, no more drops, as we had seen on previous occasions.
And the Bigger picture.
This is a Bitcoin Channel image.
See how EVERY Low has bounced off that same channel line since 2017. An ever rising LOW
That line is the channel 0,25 line and the line of rejection in the last cycle, where the 2925 ATH was formed, is the channel 1 line. Notice how that was used previously in every cycle.
See how PA leveled out or Rose around that BEARISH SMA crossover.
Lets come back to where we are now.
The projected Crossover is end July / start August.....
Does this mean we have more Drops in PA to come ?
No
Remember in post 2017, we saw PA rise BEFORE the crossover.....anything up to 100 days before....and that is approx where we are now.
But we shoudl remain cautious, Bullish Cautious....I do believe the Bear Bottom was reached a ong time ago and we are n the verge of the Next push....But it maybe tomorrow or in August to October.
We just have to wait.......but it will be worth it.

Nothing to be taken as Financial advice.
I will always say
"Only invest what you can afford to loose. When you are ready, take out your original investment. This way, it is only your profit that is at risk"
THAT is Financial advice
I will always say
"Only invest what you can afford to loose. When you are ready, take out your original investment. This way, it is only your profit that is at risk"
THAT is Financial advice
Declinazione di responsabilità
Le informazioni e le pubblicazioni non sono intese come, e non costituiscono, consulenza o raccomandazioni finanziarie, di investimento, di trading o di altro tipo fornite o approvate da TradingView. Per ulteriori informazioni, consultare i Termini di utilizzo.
Nothing to be taken as Financial advice.
I will always say
"Only invest what you can afford to loose. When you are ready, take out your original investment. This way, it is only your profit that is at risk"
THAT is Financial advice
I will always say
"Only invest what you can afford to loose. When you are ready, take out your original investment. This way, it is only your profit that is at risk"
THAT is Financial advice
Declinazione di responsabilità
Le informazioni e le pubblicazioni non sono intese come, e non costituiscono, consulenza o raccomandazioni finanziarie, di investimento, di trading o di altro tipo fornite o approvate da TradingView. Per ulteriori informazioni, consultare i Termini di utilizzo.