
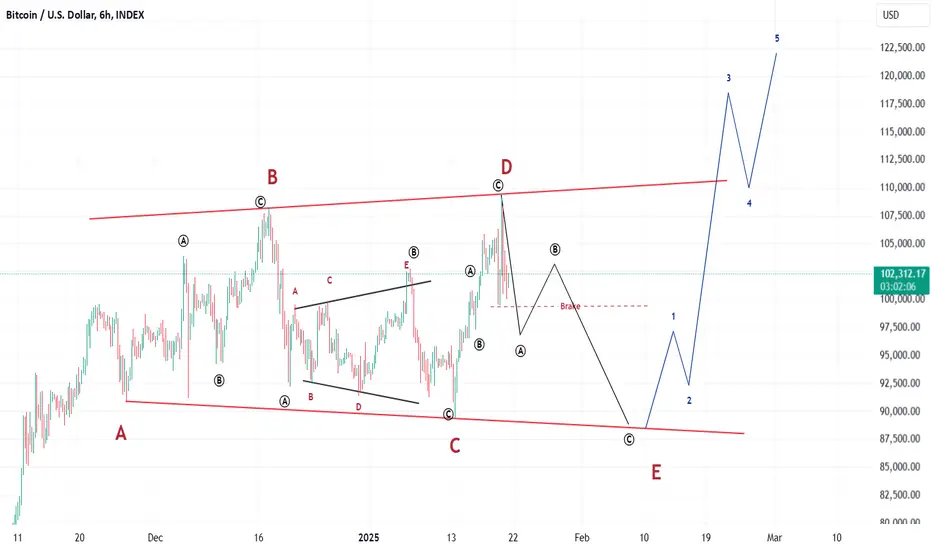
BTC peaked on November 23 and then entered a sideways corrective formation.
The corrective formation is called a reverse triangle, and it is characterized by the following features:
Three consecutive lower bottoms (A-B-C)
Two consecutive higher tops (B-D)
With the potential completion of the E bottom of the triangle, we can take a buy position on a lower timeframe if we identify a reversal pattern at the bottoms.
The initial target is a new all-time high.
The corrective formation is called a reverse triangle, and it is characterized by the following features:
Three consecutive lower bottoms (A-B-C)
Two consecutive higher tops (B-D)
With the potential completion of the E bottom of the triangle, we can take a buy position on a lower timeframe if we identify a reversal pattern at the bottoms.
The initial target is a new all-time high.

Declinazione di responsabilità
Le informazioni e le pubblicazioni non sono intese come, e non costituiscono, consulenza o raccomandazioni finanziarie, di investimento, di trading o di altro tipo fornite o approvate da TradingView. Per ulteriori informazioni, consultare i Termini di utilizzo.
Declinazione di responsabilità
Le informazioni e le pubblicazioni non sono intese come, e non costituiscono, consulenza o raccomandazioni finanziarie, di investimento, di trading o di altro tipo fornite o approvate da TradingView. Per ulteriori informazioni, consultare i Termini di utilizzo.