
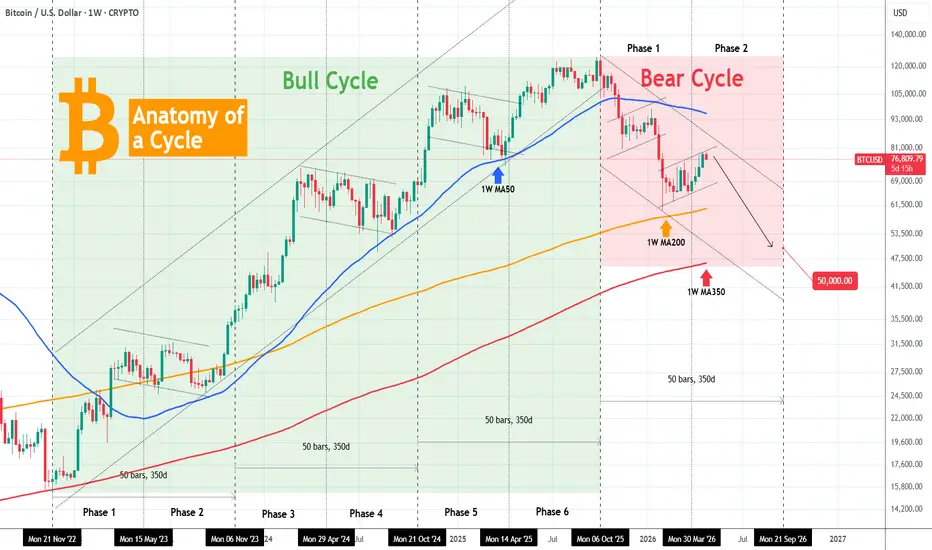
This chart is a detailed analysis of Bitcoin's (BTCUSD) full Cycle activity both Bull and Bear. The symmetry of the Bull Cycle has been incredible, from Bottom to Top it can be divided exactly into three Stages of 50 weeks (350 days) each and those further into two, bringing us 6 Phases in total.
If we apply the same 350 day duration on the Bear Cycle from its October 06 2025 Top, we get a September 21 2026 potential Bottom expectation, which is virtually the same as early October two weeks later. Applying the same Phase structure, we can see that BTC has already entered Phase 2, which is obviously the final one of the Bear Cycle.
This 'Tomography' also confirms the 4-year Cycle Theory and it remains to be seen at which price the Bear Cycle bottoms. The previous one bottomed exactly on the 1W MA350 (red trend-line), so as mentioned many times before, we are looking for at least a $50000 test before it bottoms (more likely around 45k).
So what do you think? Does this 'Tomography' help get things into perspective on the current Bear Cycle? Feel free to let us know in the comments section below!
---
** Please LIKE 👍, FOLLOW ✅, SHARE 🙌 and COMMENT ✍ if you enjoy this idea! Also share your ideas and charts in the comments section below! This is best way to keep it relevant, support us, keep the content here free and allow the idea to reach as many people as possible. **
---
💸💸💸💸💸💸
👇 👇 👇 👇 👇 👇
If we apply the same 350 day duration on the Bear Cycle from its October 06 2025 Top, we get a September 21 2026 potential Bottom expectation, which is virtually the same as early October two weeks later. Applying the same Phase structure, we can see that BTC has already entered Phase 2, which is obviously the final one of the Bear Cycle.
This 'Tomography' also confirms the 4-year Cycle Theory and it remains to be seen at which price the Bear Cycle bottoms. The previous one bottomed exactly on the 1W MA350 (red trend-line), so as mentioned many times before, we are looking for at least a $50000 test before it bottoms (more likely around 45k).
So what do you think? Does this 'Tomography' help get things into perspective on the current Bear Cycle? Feel free to let us know in the comments section below!
---
** Please LIKE 👍, FOLLOW ✅, SHARE 🙌 and COMMENT ✍ if you enjoy this idea! Also share your ideas and charts in the comments section below! This is best way to keep it relevant, support us, keep the content here free and allow the idea to reach as many people as possible. **
---
💸💸💸💸💸💸
👇 👇 👇 👇 👇 👇

I trade Crypto, Forex, Indices & Commodities on PrimeXBT — all from one account with TradingView charts 👉 tradingshot.short.gy/PrimeXBT
I also use TradeNation for fixed spreads & zero commission 👉 tradingshot.short.gy/Tradenation
I also use TradeNation for fixed spreads & zero commission 👉 tradingshot.short.gy/Tradenation
Declinazione di responsabilità
Le informazioni e le pubblicazioni non sono intese come, e non costituiscono, consulenza o raccomandazioni finanziarie, di investimento, di trading o di altro tipo fornite o approvate da TradingView. Per ulteriori informazioni, consultare i Termini di utilizzo.
I trade Crypto, Forex, Indices & Commodities on PrimeXBT — all from one account with TradingView charts 👉 tradingshot.short.gy/PrimeXBT
I also use TradeNation for fixed spreads & zero commission 👉 tradingshot.short.gy/Tradenation
I also use TradeNation for fixed spreads & zero commission 👉 tradingshot.short.gy/Tradenation
Declinazione di responsabilità
Le informazioni e le pubblicazioni non sono intese come, e non costituiscono, consulenza o raccomandazioni finanziarie, di investimento, di trading o di altro tipo fornite o approvate da TradingView. Per ulteriori informazioni, consultare i Termini di utilizzo.