
📊 BTC/USD 4H Market Structure Analysis
🧭 1️⃣ Macro Structure: Bearish Context
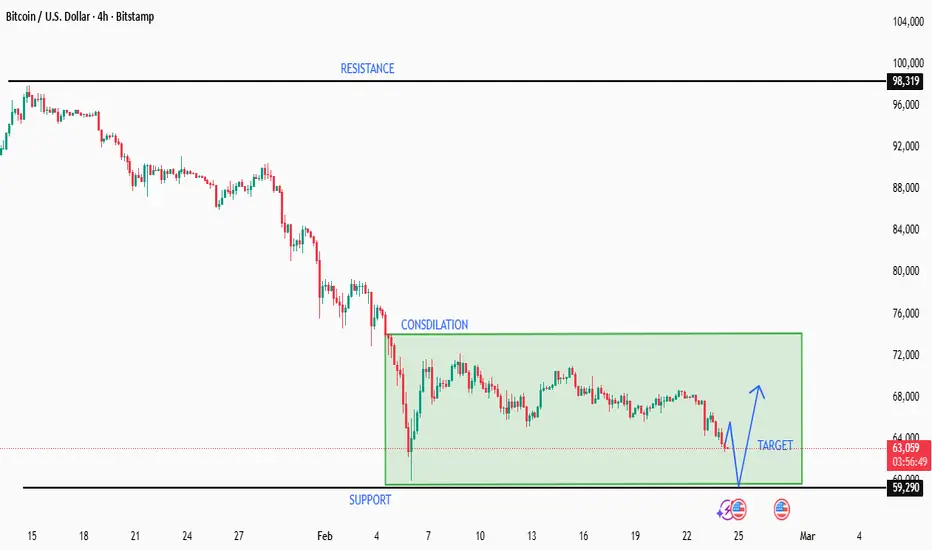
The chart clearly shows a strong impulsive downtrend from the highs near $98,319 (Resistance).
🔻 We observe:
Series of lower highs (LH)
Series of lower lows (LL)
Strong momentum breakdown into early February
This confirms that the primary market structure remains bearish.
📦 2️⃣ Current Phase: Range / Consolidation
Price is now trading inside a well-defined range:
🧱 Resistance (Range High): ~ $72,000
🛡 Support (Range Low): ~ $59,290
💰 Current price: ~$63,135
This is a classic post-impulse consolidation zone.
What This Means:
After a strong sell-off, the market is:
Absorbing supply
Building liquidity
Preparing for expansion
Range behavior suggests accumulation or distribution before the next major move.
🛡 3️⃣ Key Support: $59,290
This is a critical structural level.
If price:
✅ Holds → Potential bounce toward range highs ($70K–$72K)
❌ Breaks with momentum → Continuation toward new lows likely
A clean breakdown below support would confirm bearish continuation and invalidate short-term bullish scenarios.
🎯 4️⃣ Short-Term Projection (As Drawn on Chart)
The blue projection suggests:
Liquidity sweep below recent lows
Reaction from support
Rally toward mid-range or range high
This would be a typical:
🔎 Liquidity grab
📈 Short-term mean reversion
Before deciding the next major move
🔍 5️⃣ Volume & Structure Insight (Professional View)
This consolidation has:
Weak upward impulses
No strong bullish break of structure (BOS)
Repeated rejection near range highs
This behavior favors:
⚠️ Bearish continuation unless $72K breaks decisively.
📈 Bullish Scenario
For bullish confirmation, we need:
🔼 Strong 4H close above $72,000
Followed by higher high formation
Reclaim of broken supply
Target zones:
$76K
$80K
Then macro resistance near $98K
Probability: Lower unless structure shifts
📉 Bearish Scenario (Higher Probability)
If support fails:
First target: $55K
Then potential extension toward $50K–$48K
Momentum continuation toward macro liquidity
This aligns with:
Existing downtrend
Lack of bullish structure
Weak recovery legs
🧠 Professional Conclusion
📌 Macro Trend: Bearish
📌 Current Phase: Range Consolidation
📌 Key Decision Zone: $59,290
📌 Bias: Slightly Bearish until proven otherwise
This is a classic:
“Range inside a downtrend” — typically continuation structure.
🧭 1️⃣ Macro Structure: Bearish Context
The chart clearly shows a strong impulsive downtrend from the highs near $98,319 (Resistance).
🔻 We observe:
Series of lower highs (LH)
Series of lower lows (LL)
Strong momentum breakdown into early February
This confirms that the primary market structure remains bearish.
📦 2️⃣ Current Phase: Range / Consolidation
Price is now trading inside a well-defined range:
🧱 Resistance (Range High): ~ $72,000
🛡 Support (Range Low): ~ $59,290
💰 Current price: ~$63,135
This is a classic post-impulse consolidation zone.
What This Means:
After a strong sell-off, the market is:
Absorbing supply
Building liquidity
Preparing for expansion
Range behavior suggests accumulation or distribution before the next major move.
🛡 3️⃣ Key Support: $59,290
This is a critical structural level.
If price:
✅ Holds → Potential bounce toward range highs ($70K–$72K)
❌ Breaks with momentum → Continuation toward new lows likely
A clean breakdown below support would confirm bearish continuation and invalidate short-term bullish scenarios.
🎯 4️⃣ Short-Term Projection (As Drawn on Chart)
The blue projection suggests:
Liquidity sweep below recent lows
Reaction from support
Rally toward mid-range or range high
This would be a typical:
🔎 Liquidity grab
📈 Short-term mean reversion
Before deciding the next major move
🔍 5️⃣ Volume & Structure Insight (Professional View)
This consolidation has:
Weak upward impulses
No strong bullish break of structure (BOS)
Repeated rejection near range highs
This behavior favors:
⚠️ Bearish continuation unless $72K breaks decisively.
📈 Bullish Scenario
For bullish confirmation, we need:
🔼 Strong 4H close above $72,000
Followed by higher high formation
Reclaim of broken supply
Target zones:
$76K
$80K
Then macro resistance near $98K
Probability: Lower unless structure shifts
📉 Bearish Scenario (Higher Probability)
If support fails:
First target: $55K
Then potential extension toward $50K–$48K
Momentum continuation toward macro liquidity
This aligns with:
Existing downtrend
Lack of bullish structure
Weak recovery legs
🧠 Professional Conclusion
📌 Macro Trend: Bearish
📌 Current Phase: Range Consolidation
📌 Key Decision Zone: $59,290
📌 Bias: Slightly Bearish until proven otherwise
This is a classic:
“Range inside a downtrend” — typically continuation structure.
Trade attivo
Yes — your analysis is working ✅
Price is moving toward range high (70–72K) 🎯
Now watch:
🔼 Strong break above 72K → continuation up
🔽 Rejection near 70–72K → drop back into range
Take profits into resistance. Don’t get greedy. 🔥
Trade chiuso: obiettivo raggiunto
✅ BTC/USD Trade Outcome – Target Hit 🎯
The projected scenario on this chart played out successfully.
Price swept liquidity below the recent lows 🧹, reacted strongly from the $59,290 support, and delivered the anticipated bounce inside the range.
📈 The move confirmed:
Clean liquidity grab
Strong reaction from key structural support
Short-term bullish expansion within a broader bearish trend
This was a textbook range reaction setup inside a macro downtrend.
Professional takeaway:
Structure + liquidity + patience = high-probability execution.

Pubblicazioni correlate
Declinazione di responsabilità
Le informazioni e le pubblicazioni non sono intese come, e non costituiscono, consulenza o raccomandazioni finanziarie, di investimento, di trading o di altro tipo fornite o approvate da TradingView. Per ulteriori informazioni, consultare i Termini di utilizzo.
Pubblicazioni correlate
Declinazione di responsabilità
Le informazioni e le pubblicazioni non sono intese come, e non costituiscono, consulenza o raccomandazioni finanziarie, di investimento, di trading o di altro tipo fornite o approvate da TradingView. Per ulteriori informazioni, consultare i Termini di utilizzo.