
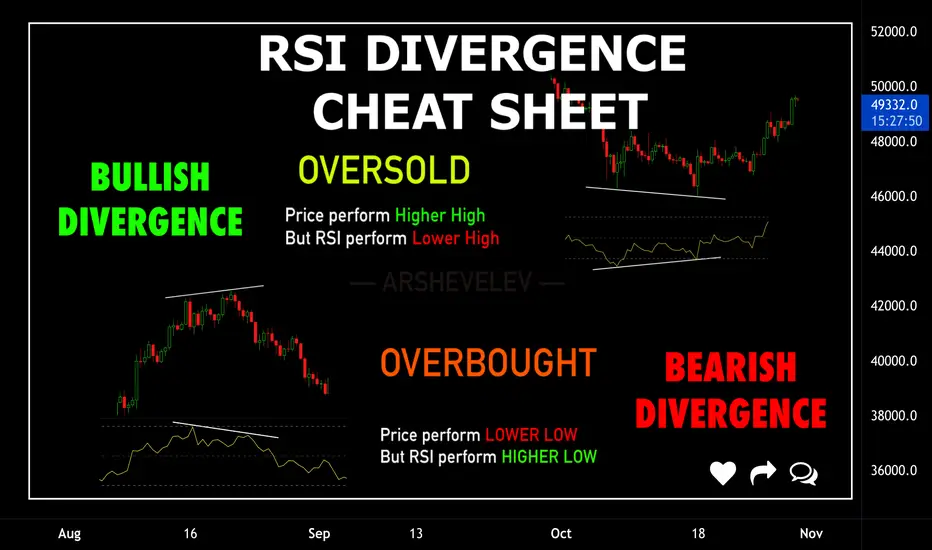
RSI can be beneficial in your trading if you use it correctly. This printable cheat sheet will assist you in divergence, so you can trade more precisely and increase your profits.
To print this cheat sheet, Right-click the illustration below and then click Save as Picture.

What Is RSI Divergence? With RSI divergence, the relative strength index of a specific asset shows lower highs when the price uptrend hits higher highs. Conversely, when the price is trending downward, it will hit lower lows with divergence while the RSI hits higher lows.
In a bullish divergence scenario you will see RSI show what is called being OVERSOLD and you will see price action form a lower low while the indicator shows a higher low. This represents a transition of volume from seller to buyers and the last push lower is sellers LAST attempt to take control.
The opposite is true for a bearish divergence scenario. You will see price action form a higher high, the last attempt from buyers, while RSI shows a lower high. This is a classic OVERBOUGHT setup and can be very profitable when combined with the rest of your technical analysis.
Those setups give us reversal signal in trending markets as well as ranging markets.
Keep in mind using one strategy is not enough to have consistent profits. Use combinations of strategies and setups to increase your winning rate. Always trade with affordable risk.
What indicator do you use for Divergence? Let us know in the comments
Have a best profits
Artem Shevelev
To print this cheat sheet, Right-click the illustration below and then click Save as Picture.
What Is RSI Divergence? With RSI divergence, the relative strength index of a specific asset shows lower highs when the price uptrend hits higher highs. Conversely, when the price is trending downward, it will hit lower lows with divergence while the RSI hits higher lows.
In a bullish divergence scenario you will see RSI show what is called being OVERSOLD and you will see price action form a lower low while the indicator shows a higher low. This represents a transition of volume from seller to buyers and the last push lower is sellers LAST attempt to take control.
The opposite is true for a bearish divergence scenario. You will see price action form a higher high, the last attempt from buyers, while RSI shows a lower high. This is a classic OVERBOUGHT setup and can be very profitable when combined with the rest of your technical analysis.
Those setups give us reversal signal in trending markets as well as ranging markets.
Keep in mind using one strategy is not enough to have consistent profits. Use combinations of strategies and setups to increase your winning rate. Always trade with affordable risk.
What indicator do you use for Divergence? Let us know in the comments
Have a best profits
Artem Shevelev

Pubblicazioni correlate
Declinazione di responsabilità
Le informazioni e le pubblicazioni non sono intese come, e non costituiscono, consulenza o raccomandazioni finanziarie, di investimento, di trading o di altro tipo fornite o approvate da TradingView. Per ulteriori informazioni, consultare i Termini di utilizzo.
Pubblicazioni correlate
Declinazione di responsabilità
Le informazioni e le pubblicazioni non sono intese come, e non costituiscono, consulenza o raccomandazioni finanziarie, di investimento, di trading o di altro tipo fornite o approvate da TradingView. Per ulteriori informazioni, consultare i Termini di utilizzo.