Bitcoin ( BTC) Daily: Severe Volume Drying Highlights Imminent Volatility Expansion Inside Tight Apex Node
### ₿ Bitcoin / U.S. Dollar ( BTCUSD) Daily Technical Matrix (Ref: BTCUSD_2026-08-07_09-08-56.png)
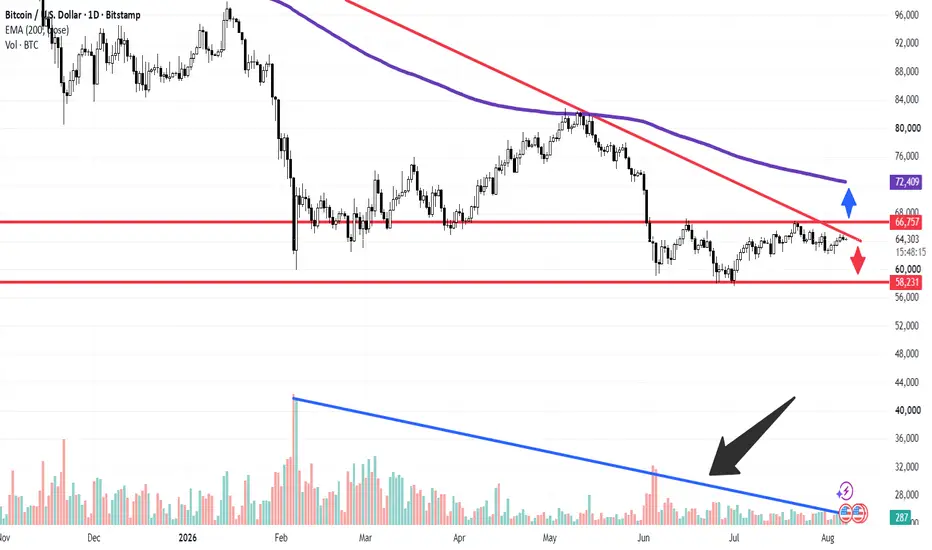
We are releasing an updated Daily (1D) structural framework on Bitcoin (BTCUSD / BTC). Price action has compressed into a narrow wedge apex directly below horizontal static supply, accompanied by a textbook drying up of trading volume across major spot exchanges.
Bitcoin is currently trading essentially flat at **64,278 (+0.03%)**, trapped within a high-compression decision zone.
---
### 🔍 Technical Architecture & Volume Divergence Analysis:
Our quantitative setup isolates the key structural mechanics shaping the market:
1. **Volume Contraction (Black Arrow & Blue Baseline):** As emphasized by the descending blue trendline on the volume panel, trading volume has steadily decreased to minimal participation levels (**287 BTC** on current daily readings). This extreme drop in liquidity during price consolidation typically signals a "calm before the storm," where low volume precedes a massive directional volatility expansion.
2. **Descending Resistance Structure (Red LTB Line):** Lower highs continue to compress price action against the primary descending trendline (red LTB) and the major horizontal resistance ceiling at **66,757**.
3. **Primary Structural Support Floor:** Sell-side risk is buffered by the established horizontal support baseline at **58,231**, where buyers previously absorbed supply.
---
### 🛡️ Strategic Directional Scenarios (Blue vs. Red Arrow Projections):
* **Scenario A — Bullish Volume Expansion Breakout (Blue Arrow):** A high-volume daily close breaking above the red LTB and reclaiming the **66,757** resistance ceiling will confirm an upside breakout, opening the path for a mean-reversion rally toward the institutional **200-period EMA (purple line at 72,409)**.
* **Scenario B — Bearish Breakdown Extension (Red Arrow):** A failure to break overhead supply, combined with persistent buy-side volume exhaustion, will lead to a rejection off the LTB, risking a retest and eventual breakdown below the **58,231** support floor.
### 📊 Tactical Parameters Summary:
* **Current Bias:** High-Compression Neutral / Imminent Volatility Breakout
* **Key Overhead Resistance Ceiling:** 66,757
* **Major Upside Reclaim Target (200-EMA):** 72,409
* **Primary Downside Support Base:** 58,231
* **Structural Catalyst:** Volume Drying / Apex Squeeze
---
📊 **ChartPro Data**
*Digital Asset Architecture, Volume Microstructure & Systematic Risk Management.*
⚠️ **Disclaimer:** For educational and informational purposes only. This active market study represents a personal trading framework and does not constitute financial or investment advice.
BTC) Daily: Severe Volume Drying Highlights Imminent Volatility Expansion Inside Tight Apex Node### ₿ Bitcoin / U.S. Dollar (
BTCUSD) Daily Technical Matrix (Ref: BTCUSD_2026-08-07_09-08-56.png)We are releasing an updated Daily (1D) structural framework on Bitcoin (
BTCUSD / BTC). Price action has compressed into a narrow wedge apex directly below horizontal static supply, accompanied by a textbook drying up of trading volume across major spot exchanges.Bitcoin is currently trading essentially flat at **64,278 (+0.03%)**, trapped within a high-compression decision zone.
---
### 🔍 Technical Architecture & Volume Divergence Analysis:
Our quantitative setup isolates the key structural mechanics shaping the market:
1. **Volume Contraction (Black Arrow & Blue Baseline):** As emphasized by the descending blue trendline on the volume panel, trading volume has steadily decreased to minimal participation levels (**287 BTC** on current daily readings). This extreme drop in liquidity during price consolidation typically signals a "calm before the storm," where low volume precedes a massive directional volatility expansion.
2. **Descending Resistance Structure (Red LTB Line):** Lower highs continue to compress price action against the primary descending trendline (red LTB) and the major horizontal resistance ceiling at **66,757**.
3. **Primary Structural Support Floor:** Sell-side risk is buffered by the established horizontal support baseline at **58,231**, where buyers previously absorbed supply.
---
### 🛡️ Strategic Directional Scenarios (Blue vs. Red Arrow Projections):
* **Scenario A — Bullish Volume Expansion Breakout (Blue Arrow):** A high-volume daily close breaking above the red LTB and reclaiming the **66,757** resistance ceiling will confirm an upside breakout, opening the path for a mean-reversion rally toward the institutional **200-period EMA (purple line at 72,409)**.
* **Scenario B — Bearish Breakdown Extension (Red Arrow):** A failure to break overhead supply, combined with persistent buy-side volume exhaustion, will lead to a rejection off the LTB, risking a retest and eventual breakdown below the **58,231** support floor.
### 📊 Tactical Parameters Summary:
* **Current Bias:** High-Compression Neutral / Imminent Volatility Breakout
* **Key Overhead Resistance Ceiling:** 66,757
* **Major Upside Reclaim Target (200-EMA):** 72,409
* **Primary Downside Support Base:** 58,231
* **Structural Catalyst:** Volume Drying / Apex Squeeze
---
📊 **ChartPro Data**
*Digital Asset Architecture, Volume Microstructure & Systematic Risk Management.*
⚠️ **Disclaimer:** For educational and informational purposes only. This active market study represents a personal trading framework and does not constitute financial or investment advice.

Declinazione di responsabilità
Le informazioni e le pubblicazioni non sono intese come, e non costituiscono, consulenza o raccomandazioni finanziarie, di investimento, di trading o di altro tipo fornite o approvate da TradingView. Per ulteriori informazioni, consultare i Termini di utilizzo.
Declinazione di responsabilità
Le informazioni e le pubblicazioni non sono intese come, e non costituiscono, consulenza o raccomandazioni finanziarie, di investimento, di trading o di altro tipo fornite o approvate da TradingView. Per ulteriori informazioni, consultare i Termini di utilizzo.