 BTC— HIEQ Model
TQ Analysis | How Do HP Trend Rays Work?!
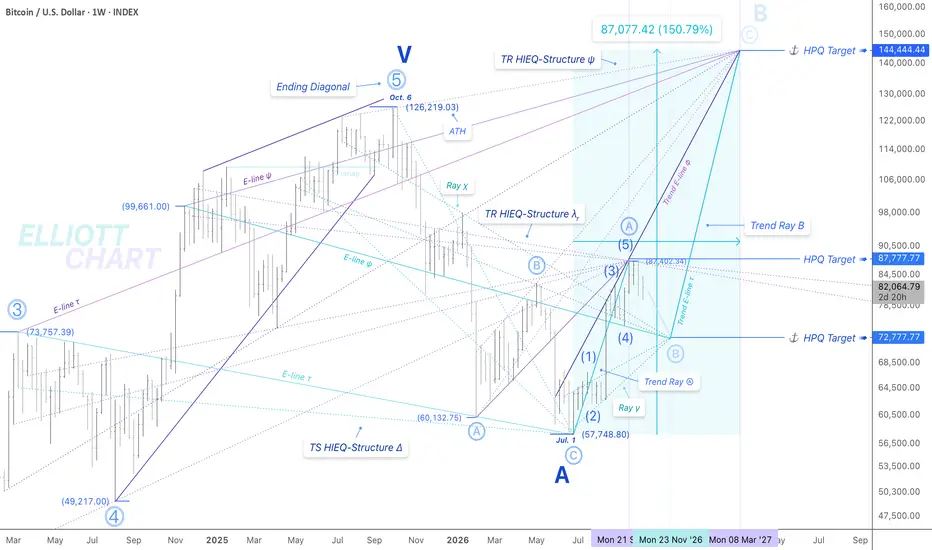
After reaching the HPQ Target ➤ $87K 🎯, defined by the TR HIEQ-Structure λᵣ confluence, BTC formed the projected peak over the past couple of weeks. Price is now pulling back into Primary Wave Ⓑ.
The correction may continue into late November, with a potential extreme point at the confluence of Rays χ and γ ➤ $72,777 ⚓️. I’ve also highlighted Trend E-line τ, anchored through the HPQ Targets defined for Waves Ⓑ and B, illustrating the projected Cycle-degree Wave B Trend Ray Advance.
During the Primary corrective phase Ⓑ, conflicting analyses may multiply as this countertrend phase develops within the broader Cycle-degree Wave B uptrend. This is where patience and quiet observation become especially important.
As autumn unfolds, nature offers its own reminder: even through uncertainty, there is beauty in the process—and intelligence in the way its structures evolve. 🍂🌲
#StrategicAnalysis #QuantumEntanglement #CymaticTrendflow #FutureVision #TimeSpaceMap #TSMap

Pubblicazioni correlate
Declinazione di responsabilità
Le informazioni e le pubblicazioni non sono intese come, e non costituiscono, consulenza o raccomandazioni finanziarie, di investimento, di trading o di altro tipo fornite o approvate da TradingView. Per ulteriori informazioni, consultare i Termini di utilizzo.
Pubblicazioni correlate
Declinazione di responsabilità
Le informazioni e le pubblicazioni non sono intese come, e non costituiscono, consulenza o raccomandazioni finanziarie, di investimento, di trading o di altro tipo fornite o approvate da TradingView. Per ulteriori informazioni, consultare i Termini di utilizzo.