
Description:
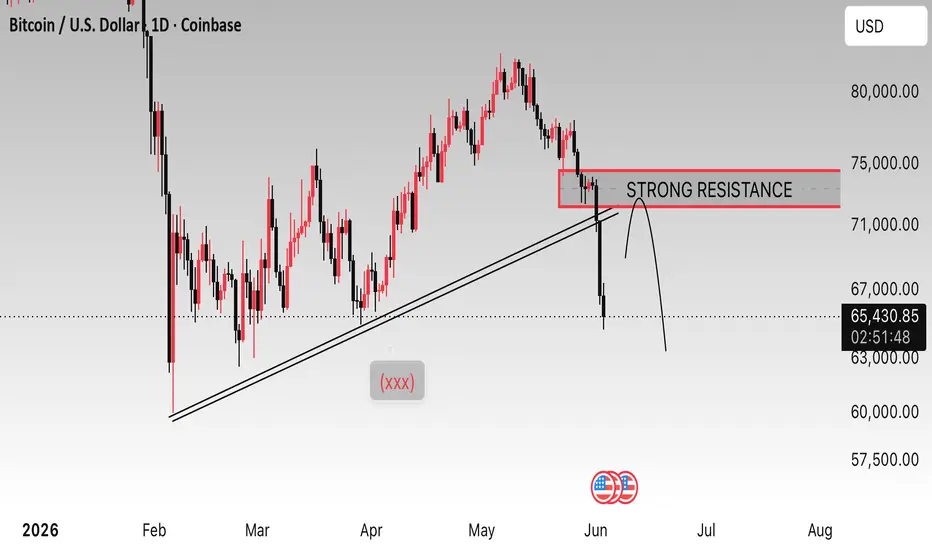
This daily Bitcoin (BTC/USD) chart shows a decisive rejection from a major resistance zone around $72,000–$74,000. Price has broken below a key ascending trendline that previously supported the uptrend, signaling weakening bullish momentum. The highlighted resistance area remains a critical level to watch, and any retest could attract renewed selling pressure. If the breakdown is confirmed, Bitcoin may face further downside toward lower support levels in the coming sessions.
Not financial advice

Declinazione di responsabilità
Le informazioni e le pubblicazioni non sono intese come, e non costituiscono, consulenza o raccomandazioni finanziarie, di investimento, di trading o di altro tipo fornite o approvate da TradingView. Per ulteriori informazioni, consultare i Termini di utilizzo.
Declinazione di responsabilità
Le informazioni e le pubblicazioni non sono intese come, e non costituiscono, consulenza o raccomandazioni finanziarie, di investimento, di trading o di altro tipo fornite o approvate da TradingView. Per ulteriori informazioni, consultare i Termini di utilizzo.