
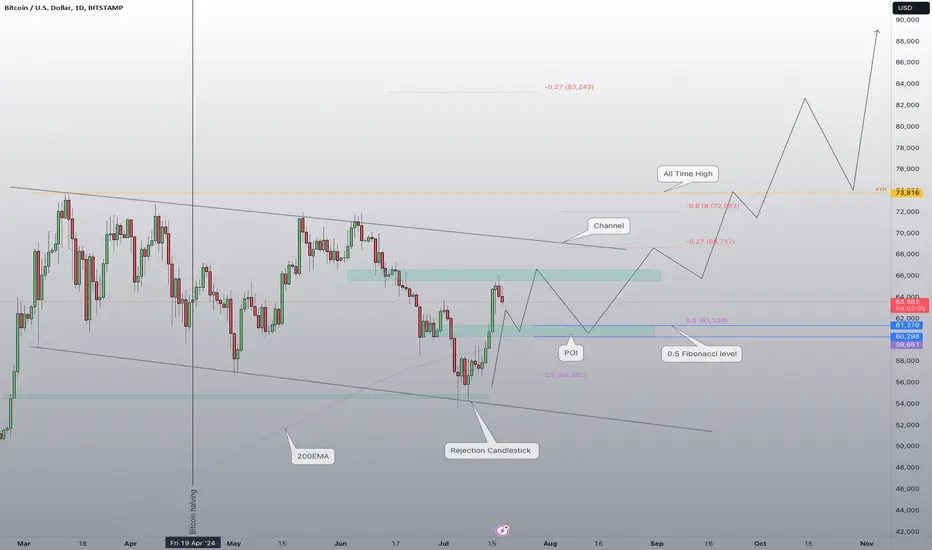
Bitcoin is currently experiencing a pullback after a bullish run lasting nine days. The next strong support zone is between $61,379 and $60,298. I anticipate Bitcoin will fall to this point of interest (POI), where we should see a reaction. There are multiple confluences suggesting a long setup, one of which is Bitcoin trading above the 200-day EMA, an important indicator of strength.

Pubblicazioni correlate
Declinazione di responsabilità
Le informazioni e le pubblicazioni non sono intese come, e non costituiscono, consulenza o raccomandazioni finanziarie, di investimento, di trading o di altro tipo fornite o approvate da TradingView. Per ulteriori informazioni, consultare i Termini di utilizzo.