Long
The RSI are talking about the BTC behavior clearly
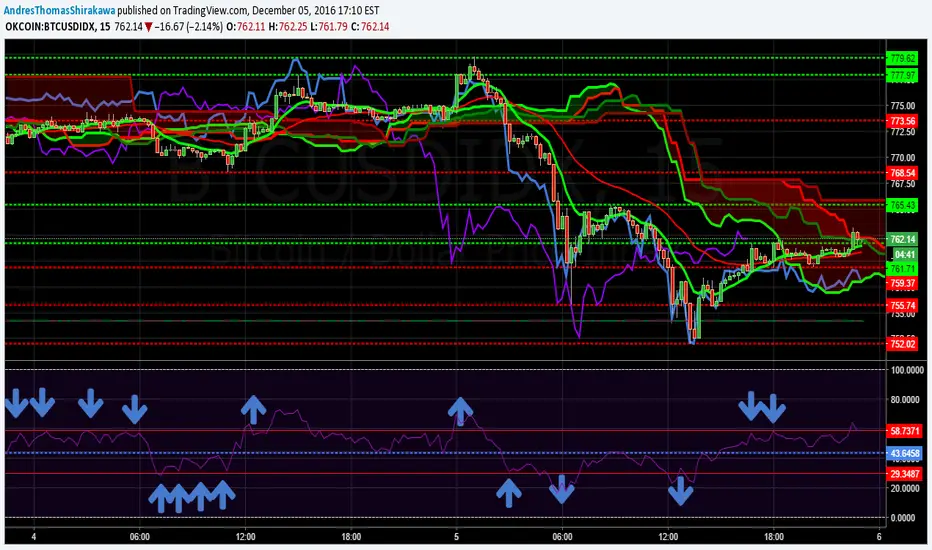
I do not like the charts for less than 2 hours. But in a 15-minute TF I observed the following pattern to draw their conclusions.
In the RSI I drew two lines generating a range between 58.7371 and 29.3487 with an average (dotted line) of 43.6458.
When it is in a trend bull moves leaning on the average of 43.6458, when this bear, the opposite.
When it breaks the ranks of 58.7371 it is breaking resistances and supports when it performs the 29.3487
In the RSI I drew two lines generating a range between 58.7371 and 29.3487 with an average (dotted line) of 43.6458.
When it is in a trend bull moves leaning on the average of 43.6458, when this bear, the opposite.
When it breaks the ranks of 58.7371 it is breaking resistances and supports when it performs the 29.3487

Declinazione di responsabilità
Le informazioni e le pubblicazioni non sono intese come, e non costituiscono, consulenza o raccomandazioni finanziarie, di investimento, di trading o di altro tipo fornite o approvate da TradingView. Per ulteriori informazioni, consultare i Termini di utilizzo.
Declinazione di responsabilità
Le informazioni e le pubblicazioni non sono intese come, e non costituiscono, consulenza o raccomandazioni finanziarie, di investimento, di trading o di altro tipo fornite o approvate da TradingView. Per ulteriori informazioni, consultare i Termini di utilizzo.