
Bitcoin Faces Key Resistance — Consolidation or Another Leg Lower?
Bitcoin continues to trade in a recovery phase after its sharp selloff, but the daily chart suggests the market has reached an important decision point.
Price recently rallied into the $67,000 resistance area, where sellers immediately stepped in and rejected the move. That reaction alone doesn't confirm a bearish trend, but it does show that buyers have not yet gained enough strength to reclaim higher prices.
The overall structure remains mixed. While short-term momentum has improved, Bitcoin is still trading below the longer-term trend resistance represented by the higher moving averages, meaning the broader market has not fully shifted back into a bullish environment.
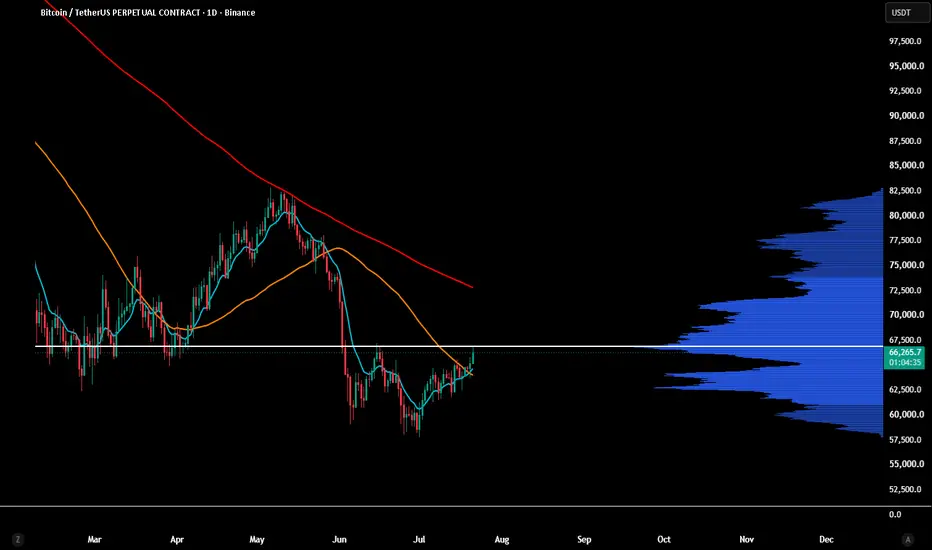
The daily chart currently shows:
Price attempting to recover after making a significant low.
Strong reaction exactly near the $67K resistance.
The 55 EMA remains above price and continues acting as dynamic resistance.
The 200 EMA is still much higher, confirming the long-term trend has not yet turned bullish.
Momentum has improved compared to previous weeks, but buyers still need confirmation through a higher high.
At the moment, this looks more like a market trying to stabilize rather than one beginning a strong breakout.
The largest concentration of traded volume sits around the $62,500-$66,000 region, indicating this is currently the market's fair value area.
This often acts like a magnet for price.
If buyers fail to break above resistance, Bitcoin could naturally rotate back toward this high-volume node before deciding its next major direction.
Below that, another important support sits near $57,500, which remains the major defensive level for bulls.
For buyers to regain control:
Bitcoin needs a convincing daily close above $67,000.
Holding above that level would suggest today's rejection was only temporary.
If buyers can establish support above resistance, the next upside objectives become the $70K-$72K region, followed by higher resistance levels if momentum continues.
Without that confirmation, bullish continuation remains speculative.
If Bitcoin cannot reclaim $67K and selling pressure increases:
A move back toward the $62,500 high-volume support becomes increasingly likely.
Losing that area could expose the market to another test near $57,500, where stronger demand would be expected.
A breakdown below those levels would weaken the current recovery structure and increase the probability of a broader bearish continuation.
What do you think? Will Bitcoin reclaim $67K, or is another test of support coming first?
This analysis is for educational purposes only and is not financial advice.
Bitcoin continues to trade in a recovery phase after its sharp selloff, but the daily chart suggests the market has reached an important decision point.
Price recently rallied into the $67,000 resistance area, where sellers immediately stepped in and rejected the move. That reaction alone doesn't confirm a bearish trend, but it does show that buyers have not yet gained enough strength to reclaim higher prices.
The overall structure remains mixed. While short-term momentum has improved, Bitcoin is still trading below the longer-term trend resistance represented by the higher moving averages, meaning the broader market has not fully shifted back into a bullish environment.
The daily chart currently shows:
Price attempting to recover after making a significant low.
Strong reaction exactly near the $67K resistance.
The 55 EMA remains above price and continues acting as dynamic resistance.
The 200 EMA is still much higher, confirming the long-term trend has not yet turned bullish.
Momentum has improved compared to previous weeks, but buyers still need confirmation through a higher high.
At the moment, this looks more like a market trying to stabilize rather than one beginning a strong breakout.
The largest concentration of traded volume sits around the $62,500-$66,000 region, indicating this is currently the market's fair value area.
This often acts like a magnet for price.
If buyers fail to break above resistance, Bitcoin could naturally rotate back toward this high-volume node before deciding its next major direction.
Below that, another important support sits near $57,500, which remains the major defensive level for bulls.
For buyers to regain control:
Bitcoin needs a convincing daily close above $67,000.
Holding above that level would suggest today's rejection was only temporary.
If buyers can establish support above resistance, the next upside objectives become the $70K-$72K region, followed by higher resistance levels if momentum continues.
Without that confirmation, bullish continuation remains speculative.
If Bitcoin cannot reclaim $67K and selling pressure increases:
A move back toward the $62,500 high-volume support becomes increasingly likely.
Losing that area could expose the market to another test near $57,500, where stronger demand would be expected.
A breakdown below those levels would weaken the current recovery structure and increase the probability of a broader bearish continuation.
What do you think? Will Bitcoin reclaim $67K, or is another test of support coming first?
This analysis is for educational purposes only and is not financial advice.

Declinazione di responsabilità
Le informazioni e le pubblicazioni non sono intese come, e non costituiscono, consulenza o raccomandazioni finanziarie, di investimento, di trading o di altro tipo fornite o approvate da TradingView. Per ulteriori informazioni, consultare i Termini di utilizzo.
Declinazione di responsabilità
Le informazioni e le pubblicazioni non sono intese come, e non costituiscono, consulenza o raccomandazioni finanziarie, di investimento, di trading o di altro tipo fornite o approvate da TradingView. Per ulteriori informazioni, consultare i Termini di utilizzo.