
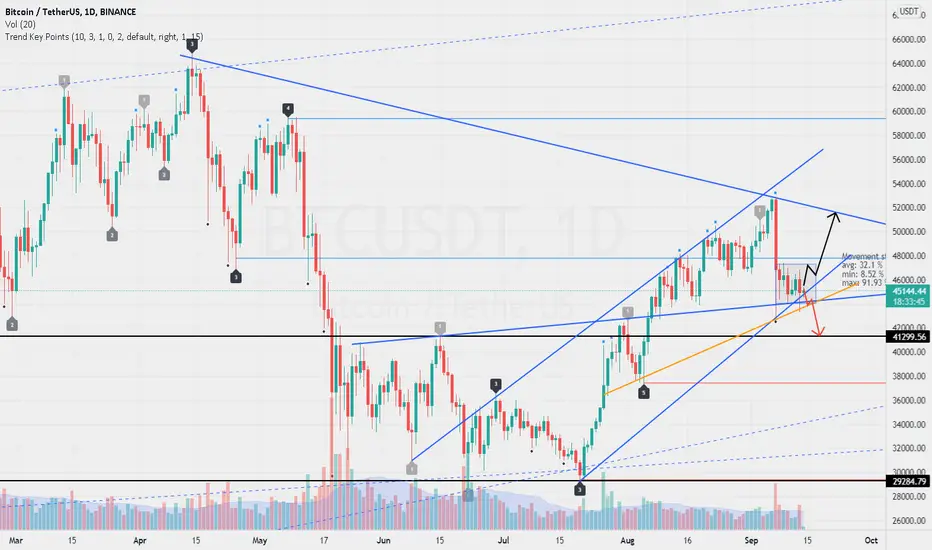
$44k is the most important support near. Its breakdown could pull the price around $41k.
The rectangle is drawn on the 1-hour time frame, I expect it to break upwards with a resistance. If so, the next stop will be between $50k and $51k.
Trend Key Points Indicator have been used to draw important key levels and key points.
The rectangle is drawn on the 1-hour time frame, I expect it to break upwards with a resistance. If so, the next stop will be between $50k and $51k.
Trend Key Points Indicator have been used to draw important key levels and key points.

Pubblicazioni correlate
Declinazione di responsabilità
Le informazioni e le pubblicazioni non sono intese come, e non costituiscono, consulenza o raccomandazioni finanziarie, di investimento, di trading o di altro tipo fornite o approvate da TradingView. Per ulteriori informazioni, consultare i Termini di utilizzo.
Pubblicazioni correlate
Declinazione di responsabilità
Le informazioni e le pubblicazioni non sono intese come, e non costituiscono, consulenza o raccomandazioni finanziarie, di investimento, di trading o di altro tipo fornite o approvate da TradingView. Per ulteriori informazioni, consultare i Termini di utilizzo.