
Is the Bitcoin bear market here? A deep dive Into cycles, tech risks & what comes next.
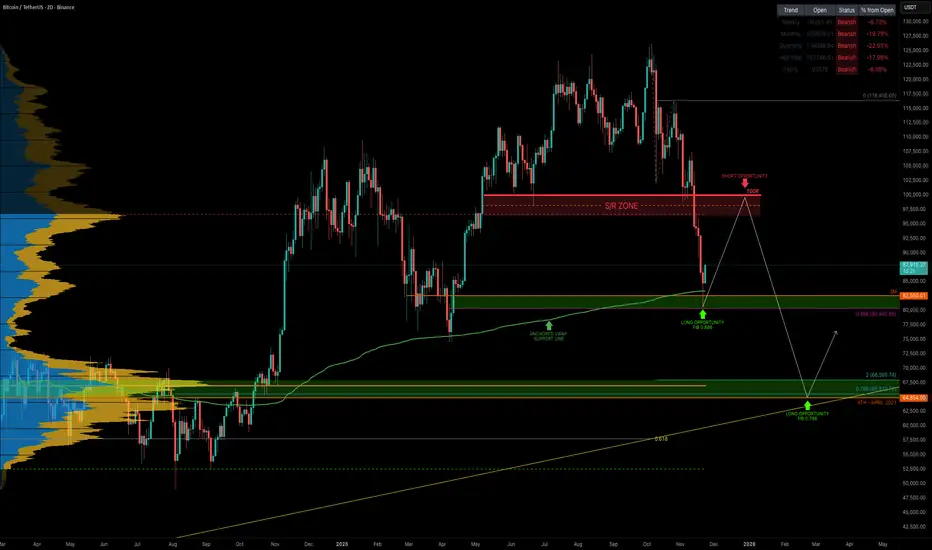
Bitcoin has now dropped –36% from its all-time high in just 46 days, and naturally the big questions emerge: Has the bear market officially begun? How long could it last? And what catalysts could accelerate it?
Let’s break this down from cycle structure to macro-technological risks.
BTC Has Turned Bearish Across All Major Timeframes
Bitcoin is now trading below the yearly open at $93,576, flipping all major timeframes into bearish alignment (from the daily to the yearly).
Monthly MACD Bearish Cross Incoming

The monthly MACD is set to print a bearish crossover this month. The last bullish MACD phase lasted 28 months, which has now ended → a strong macro signal.
Cycle Timing: What History Says
Historically, Bitcoin bottoms approximately one year after the top:
If the current cycle repeats, the macro bottom may form around:
The previous bull market lasted 1061 days, this one 1050 days → almost identical. This strongly supports the thesis that the cycle has already peaked.
How Low Could Bitcoin Go?
Macro target:
Aligning with:
Historical Precedent: The 2022 Bottom Zone
Back in 2022, Bitcoin spent 210 days (over 7 months) consolidating at the bottom of the bear market. This was especially clear on the weekly timeframe, where price formed a clean multi-month accumulation range.
Weekly TF:

Daily TF:

This is crucial context:
👉 The market gave more than half a year to load up at the bottom.
No chasing, no rushing → anyone paying attention had time to scale into positions for the next cycle.
The 2025 Macro Top Landed Perfectly in the 1.618–1.666 Fib Target
This area was the ideal sell zone, and Bitcoin respected it perfectly.
What happened after hitting the Fib target?
The market entered a 3-month distribution phase, giving plenty of time to:
Then came the aggressive sell-off → classic macro cycle behavior.
Macro Catalysts That Could Drive the Bear Market Deeper
1️⃣ Quantum Computing Acceleration
A credible quantum breakthrough (or even a strong rumor) could trigger systemic fear. Bitcoin’s ECDSA signatures are theoretically vulnerable to quantum attack models.
2️⃣ Fast-Paced AI Threats
AI is accelerating:
The risk matrix is evolving faster than coding standards can update.
3️⃣ Regulatory Momentum
Expect:
This would accelerate risk-off behavior.
Technical Confluence: Where BTC Is Now

Monthly 21 EMA/SMA → 86.6K
Current support test.
Quarterly (3M) 21 EMA/SMA
Strong structural support zone.
Half-Year (6M) 21 EMA/SMA
The EMA aligns perfectly with the 0.786 retracement → $39,173.
Remember that the EMA/SMA levels mentioned are dynamic and will continue to shift over time as new price data comes in, so these confluence zones will gradually adjust.
Additional Confluence: Potential Head & Shoulders (Bars Pattern Symmetry)

A potential Head & Shoulders Pattern is forming in symmetry with the previous bull market top, as shown through the bars pattern overlay.
Trading Playbook: Short the Bull Trap
The most likely scenario:
BTC bounces into $95K–$100K → traps late bulls → rejects → cascade lower
Targets:
Final Outlook
Bitcoin is now deeply aligned with a macro reversal:
_________________________________
💬 If you found this helpful, drop a like and comment!
Bitcoin has now dropped –36% from its all-time high in just 46 days, and naturally the big questions emerge: Has the bear market officially begun? How long could it last? And what catalysts could accelerate it?
Let’s break this down from cycle structure to macro-technological risks.
BTC Has Turned Bearish Across All Major Timeframes
Bitcoin is now trading below the yearly open at $93,576, flipping all major timeframes into bearish alignment (from the daily to the yearly).
Monthly MACD Bearish Cross Incoming
The monthly MACD is set to print a bearish crossover this month. The last bullish MACD phase lasted 28 months, which has now ended → a strong macro signal.
Cycle Timing: What History Says
Historically, Bitcoin bottoms approximately one year after the top:
- 2017 → 2018: 363 days
- 2021 → 2022: 376 days
If the current cycle repeats, the macro bottom may form around:
- October 2026
The previous bull market lasted 1061 days, this one 1050 days → almost identical. This strongly supports the thesis that the cycle has already peaked.
How Low Could Bitcoin Go?
Macro target:
- 0.786 Fibonacci Retracement → $39,173
Aligning with:
- Half-year 21 EMA confluence
- Macro corrective structures
- Prior cycle bear market depth
Historical Precedent: The 2022 Bottom Zone
Back in 2022, Bitcoin spent 210 days (over 7 months) consolidating at the bottom of the bear market. This was especially clear on the weekly timeframe, where price formed a clean multi-month accumulation range.
Weekly TF:
Daily TF:
This is crucial context:
👉 The market gave more than half a year to load up at the bottom.
No chasing, no rushing → anyone paying attention had time to scale into positions for the next cycle.
The 2025 Macro Top Landed Perfectly in the 1.618–1.666 Fib Target
- Fib 1.618–1.666 → $122,056 – $125,218
This area was the ideal sell zone, and Bitcoin respected it perfectly.
What happened after hitting the Fib target?
The market entered a 3-month distribution phase, giving plenty of time to:
- scale out
- take profit
- derisk
- rotate into stablecoins or simplified portfolios
Then came the aggressive sell-off → classic macro cycle behavior.
Macro Catalysts That Could Drive the Bear Market Deeper
1️⃣ Quantum Computing Acceleration
A credible quantum breakthrough (or even a strong rumor) could trigger systemic fear. Bitcoin’s ECDSA signatures are theoretically vulnerable to quantum attack models.
2️⃣ Fast-Paced AI Threats
AI is accelerating:
- algorithmic optimization
- cryptographic analysis
- zero-day discovery
- hardware design
The risk matrix is evolving faster than coding standards can update.
3️⃣ Regulatory Momentum
Expect:
- stablecoin restrictions
- exchange tightening
- AML/KYC global enforcement
This would accelerate risk-off behavior.
Technical Confluence: Where BTC Is Now
Monthly 21 EMA/SMA → 86.6K
Current support test.
Quarterly (3M) 21 EMA/SMA
- EMA: $58.5K
- SMA: $53.5K
Strong structural support zone.
Half-Year (6M) 21 EMA/SMA
- EMA: $39.5K
- SMA: $29.8K
The EMA aligns perfectly with the 0.786 retracement → $39,173.
Remember that the EMA/SMA levels mentioned are dynamic and will continue to shift over time as new price data comes in, so these confluence zones will gradually adjust.
Additional Confluence: Potential Head & Shoulders (Bars Pattern Symmetry)
A potential Head & Shoulders Pattern is forming in symmetry with the previous bull market top, as shown through the bars pattern overlay.
Trading Playbook: Short the Bull Trap
The most likely scenario:
BTC bounces into $95K–$100K → traps late bulls → rejects → cascade lower
Targets:
- TP1: $76K
- TP2: $70K
- Remaining: trail into $65K → $58K → $39K
Final Outlook
Bitcoin is now deeply aligned with a macro reversal:
- Perfect Fib 1.618–1.666 top
- Break of yearly open
- Cycle timing consistent
- Monthly MACD turning bearish
- Quantum + AI risk factors accelerating
- Structural confluence targets $70K → $40K
- Pattern mirroring the previous cycle top
_________________________________
💬 If you found this helpful, drop a like and comment!
Nota
100K level matches up well with both monthly and yearly VWAP (mVWAP/yVWAP):Nota
BTC Update:Bitcoin has been steadily climbing after the sharp sell-off. On the 4H timeframe, my Barflow indicator nailed the reversal perfectly at ~80K, marking the pivot where momentum shifted. Since that low, the anchored VWAP has acted as clean dynamic support, guiding price upward. We’re now pushing into resistance defined by the anchored VWAP drawn from the 107K high.
The next key levels to monitor are the weekly and monthly VWAPs, with the monthly VWAP aligning with a major resistance zone I’ve mapped out between 95K–98K
Nota
BTC Update:BTC is currently showing a striking resemblance to its price action from early 2022, based on the bars pattern comparison in the screenshot. Back then, this structure marked the beginning of the bear market characterized by failed recoveries, and progressively lower highs.
Right now, price is mirroring that same sequence → losing momentum, failing to establish a strong higher high. While history doesn’t repeat perfectly, it often rhymes and this fractal does suggest caution!
What I’d like to see next from BTC is a move up into that 97K–100K resistance zone that’s where things could get really interesting. If we get a push into that zone, it could set up one of the best short opportunities, with 68-65K as the main target.
For now, BTC is still holding above the 21 EMA/SMA support zone (87,2K–87,6K), so the door is definitely still open for a move higher before any bigger correction kicks in.
Let’s see how it plays out. Patience!
Stay sharp friends
Nota
BTC update:It’s amazing to see how BTC continues to follow the early 2022 price action based on bar pattern comparison

🏆 Mastering Fibonacci for precision trading
🔹 Sharing high-probability trade setups
⚡ Unlock the power of technical analysis!
🔹 Sharing high-probability trade setups
⚡ Unlock the power of technical analysis!
Pubblicazioni correlate
Declinazione di responsabilità
Le informazioni e le pubblicazioni non sono intese come, e non costituiscono, consulenza o raccomandazioni finanziarie, di investimento, di trading o di altro tipo fornite o approvate da TradingView. Per ulteriori informazioni, consultare i Termini di utilizzo.
🏆 Mastering Fibonacci for precision trading
🔹 Sharing high-probability trade setups
⚡ Unlock the power of technical analysis!
🔹 Sharing high-probability trade setups
⚡ Unlock the power of technical analysis!
Pubblicazioni correlate
Declinazione di responsabilità
Le informazioni e le pubblicazioni non sono intese come, e non costituiscono, consulenza o raccomandazioni finanziarie, di investimento, di trading o di altro tipo fornite o approvate da TradingView. Per ulteriori informazioni, consultare i Termini di utilizzo.