
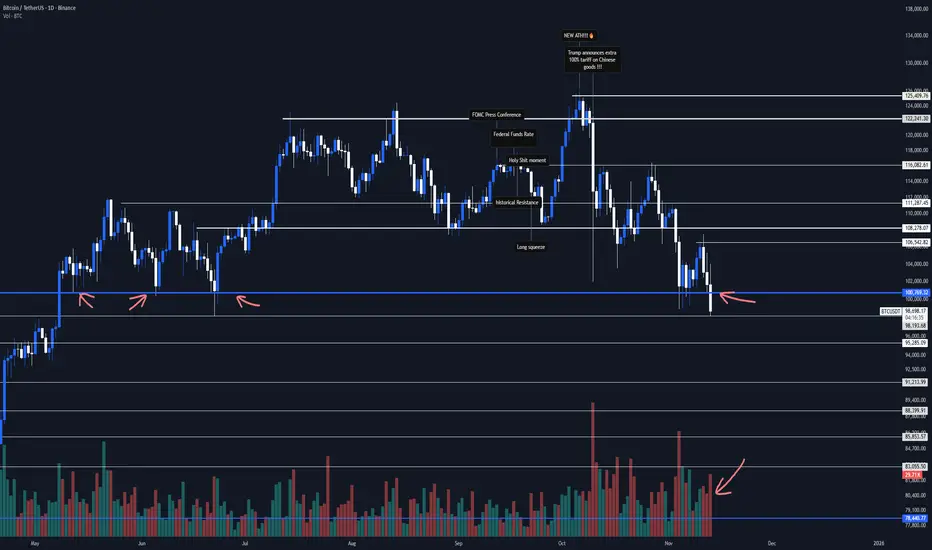
Ladies and gentlemen, as I'm writing this idea on November 13, 2025, Bitcoin is in the midst of breaking its crucial 100k daily support. Let's dive into a quick analysis together and figure out what we should do next.
If the daily candle closes like this, what does it mean? Starting with the candle itself: upper shadow about 1.5x the body, tiny lower shadow, and a solid body. This screams that buyers tried hard to drive the price up—they burned through a ton of cash—but sellers absolutely crushed them, dragging it right back down to the support level with overwhelming force. That leaves buyers running on fumes for any follow-through, and a sharp 10-15% plunge? Totally not out of the question after a candle like this. Not trying to scare you—just calling it like the chart sees it.
Point two: Before this floor break, we were consistently printing lower highs, with volume dipping during corrections and spiking on the drops.
So, what's next? If the candle closes in this shape, come next week, every scenario shifts to short-only—we're not even entertaining longs anymore. Scenario B: If this candle reverses with a strong shadow and closes back above 100k, tomorrow we'll ABSOLUTELY hunt for long positions, as it'd form a classic V-pattern in the lower timeframes. Either way, we gotta be ready.
Interesting note: Dominance is climbing alongside Bitcoin's dump, which means shorts on altcoins could yield even sweeter profits going forward. USDT.D is closing above its daily resistance too—not a good sign for the market at all, and it supercharges our bearish scenario.
That's it... Now, after reading this, go do your own market analysis—far away from any FOMO. Grab a notebook, jot down every scenario, and map out your Plan A, B, C, D... And for the love of gains, don't forget capital management. Now get outta here.
If the daily candle closes like this, what does it mean? Starting with the candle itself: upper shadow about 1.5x the body, tiny lower shadow, and a solid body. This screams that buyers tried hard to drive the price up—they burned through a ton of cash—but sellers absolutely crushed them, dragging it right back down to the support level with overwhelming force. That leaves buyers running on fumes for any follow-through, and a sharp 10-15% plunge? Totally not out of the question after a candle like this. Not trying to scare you—just calling it like the chart sees it.
Point two: Before this floor break, we were consistently printing lower highs, with volume dipping during corrections and spiking on the drops.
So, what's next? If the candle closes in this shape, come next week, every scenario shifts to short-only—we're not even entertaining longs anymore. Scenario B: If this candle reverses with a strong shadow and closes back above 100k, tomorrow we'll ABSOLUTELY hunt for long positions, as it'd form a classic V-pattern in the lower timeframes. Either way, we gotta be ready.
Interesting note: Dominance is climbing alongside Bitcoin's dump, which means shorts on altcoins could yield even sweeter profits going forward. USDT.D is closing above its daily resistance too—not a good sign for the market at all, and it supercharges our bearish scenario.
That's it... Now, after reading this, go do your own market analysis—far away from any FOMO. Grab a notebook, jot down every scenario, and map out your Plan A, B, C, D... And for the love of gains, don't forget capital management. Now get outta here.

Pubblicazioni correlate
Declinazione di responsabilità
Le informazioni e le pubblicazioni non sono intese come, e non costituiscono, consulenza o raccomandazioni finanziarie, di investimento, di trading o di altro tipo fornite o approvate da TradingView. Per ulteriori informazioni, consultare i Termini di utilizzo.
Pubblicazioni correlate
Declinazione di responsabilità
Le informazioni e le pubblicazioni non sono intese come, e non costituiscono, consulenza o raccomandazioni finanziarie, di investimento, di trading o di altro tipo fornite o approvate da TradingView. Per ulteriori informazioni, consultare i Termini di utilizzo.