
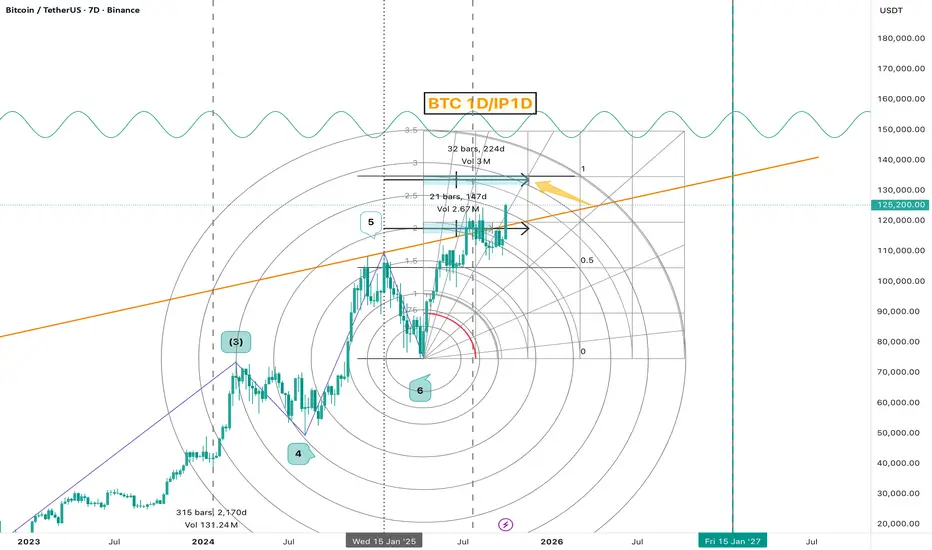
Here's a technical analysis of your BTC chart:
📊 **Chart Overview: BTCUSDT 7D (Weekly) Timeframe**
🎯 **Key Patterns Identified:**
**1. Cup & Handle Formation** ☕
- Large cup pattern formed from 2023-2024
- Handle currently forming in the consolidation zone
- Classic bullish continuation pattern
- Breakout target potentially above $150K based on cup depth
**2. Fibonacci Levels** 📐
- Price consolidated around 0.5 Fibonacci retracement (~$125K area)
- Strong resistance at 0.618 level
- Currently testing key support/resistance zone
**3. Trend Analysis** 📈
- **Orange ascending trendline**: Long-term bullish support from 2023
- Price respecting this major uptrend
- Multiple touches confirm validity
**4. TesseractPro Oscillator** 🌊
- Currently showing: 2,159.10 / 1,187.49
- Peaked and now declining
- Suggests momentum cooling off
- Potential bearish divergence forming
**5. Volume Analysis** 📊
- **Vol 3M**: Shows declining volume during recent consolidation
- Lower volume = weaker conviction
- Need volume spike for breakout confirmation
**6. Price Action Zones** 🎯
- **Current Price**: ~$132,965
- **Resistance**: $140K-$150K zone
- **Support**: $110K-$120K area (handle bottom)
- **Critical support**: Orange trendline (~$90K-$100K)
**7. Cycle Analysis** ⏰
- Chart shows projection into 2027
- Suggests multi-year bullish cycle continuation
- Current consolidation is healthy for next leg up
**Scenarios:**
📈 **Bullish Case:**
- Break above $140K with volume confirms cup & handle
- Target: $180K+ based on pattern projection
- Orange trendline holds as dynamic support
📉 **Bearish Case:**
- Break below handle support (~$110K)
- Oscillator weakness continues
- Could retest orange trendline (~$90K-$100K)
- Still bullish long-term if trendline holds
**Current Status:** ⚖️
Price is in consolidation/handle formation. Oscillator weakness suggests potential pullback before next major move up. Watch for volume expansion and trendline support.
**Key Levels to Watch:**
- 🟢 Breakout: $140K+
- 🔴 Breakdown: $110K
- 🚨 Critical: $90K (trendline)
The overall structure remains bullish long-term, but short-term consolidation or pullback is possible given oscillator divergence and low volume. 📊✨

Declinazione di responsabilità
Le informazioni e le pubblicazioni non sono intese come, e non costituiscono, consulenza o raccomandazioni finanziarie, di investimento, di trading o di altro tipo fornite o approvate da TradingView. Per ulteriori informazioni, consultare i Termini di utilizzo.
Declinazione di responsabilità
Le informazioni e le pubblicazioni non sono intese come, e non costituiscono, consulenza o raccomandazioni finanziarie, di investimento, di trading o di altro tipo fornite o approvate da TradingView. Per ulteriori informazioni, consultare i Termini di utilizzo.