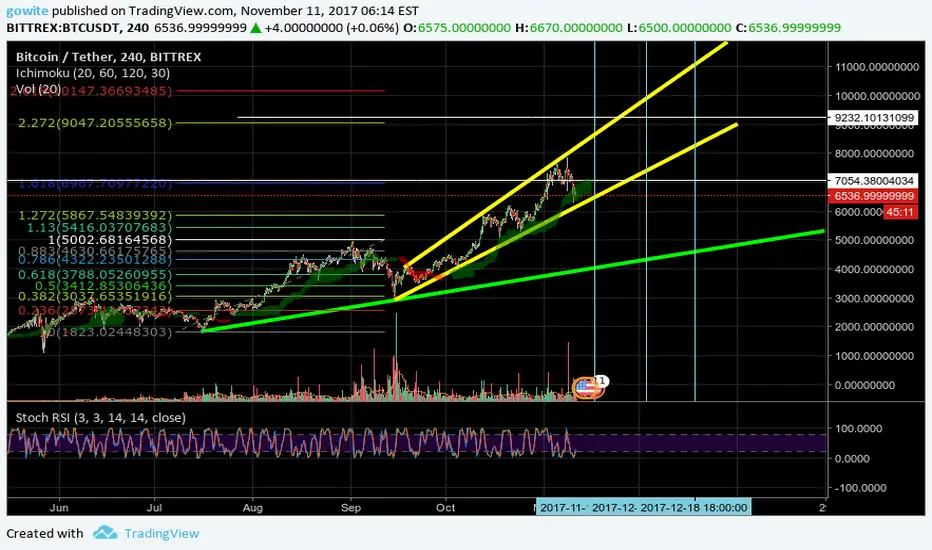
BTC followed a correction around 1.618 fib line, at least, it didn't sold under support line.
It is still in support zone. At this value, 500 usdt drops are not something huge in percentage.
The next zones that can will possibly encounter resistance are fibs 2.272-2.618 and especially 3.618.
It seems that momentum is also shaking, so it's a risky area.
If it sells under yellow support line, it can go down as more as red support line shows.
Blue lines indicate possible downtrend start days.
Remember hope for the best and prepare for the worst.
It is still in support zone. At this value, 500 usdt drops are not something huge in percentage.
The next zones that can will possibly encounter resistance are fibs 2.272-2.618 and especially 3.618.
It seems that momentum is also shaking, so it's a risky area.
If it sells under yellow support line, it can go down as more as red support line shows.
Blue lines indicate possible downtrend start days.
Remember hope for the best and prepare for the worst.

Declinazione di responsabilità
Le informazioni e le pubblicazioni non sono intese come, e non costituiscono, consulenza o raccomandazioni finanziarie, di investimento, di trading o di altro tipo fornite o approvate da TradingView. Per ulteriori informazioni, consultare i Termini di utilizzo.
Declinazione di responsabilità
Le informazioni e le pubblicazioni non sono intese come, e non costituiscono, consulenza o raccomandazioni finanziarie, di investimento, di trading o di altro tipo fornite o approvate da TradingView. Per ulteriori informazioni, consultare i Termini di utilizzo.